
Ireland’s economy is robust and growing.
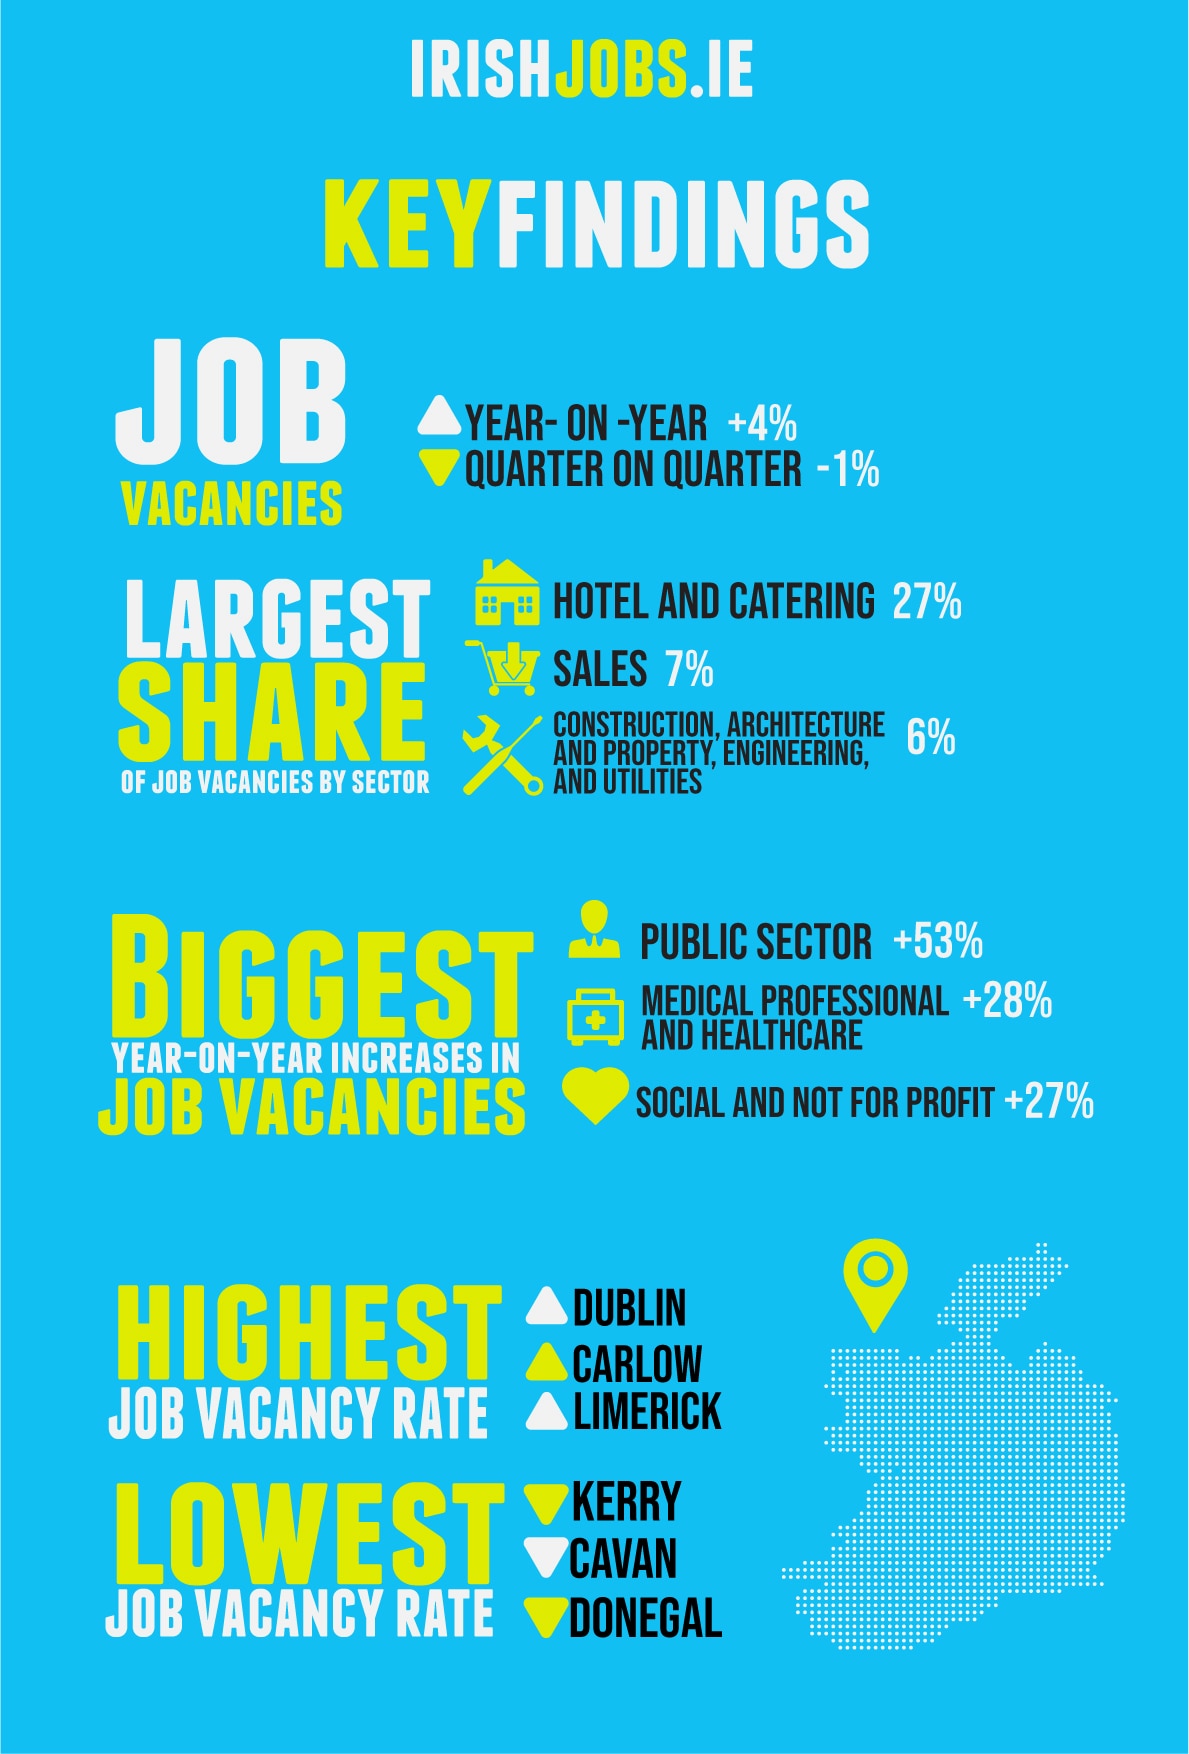
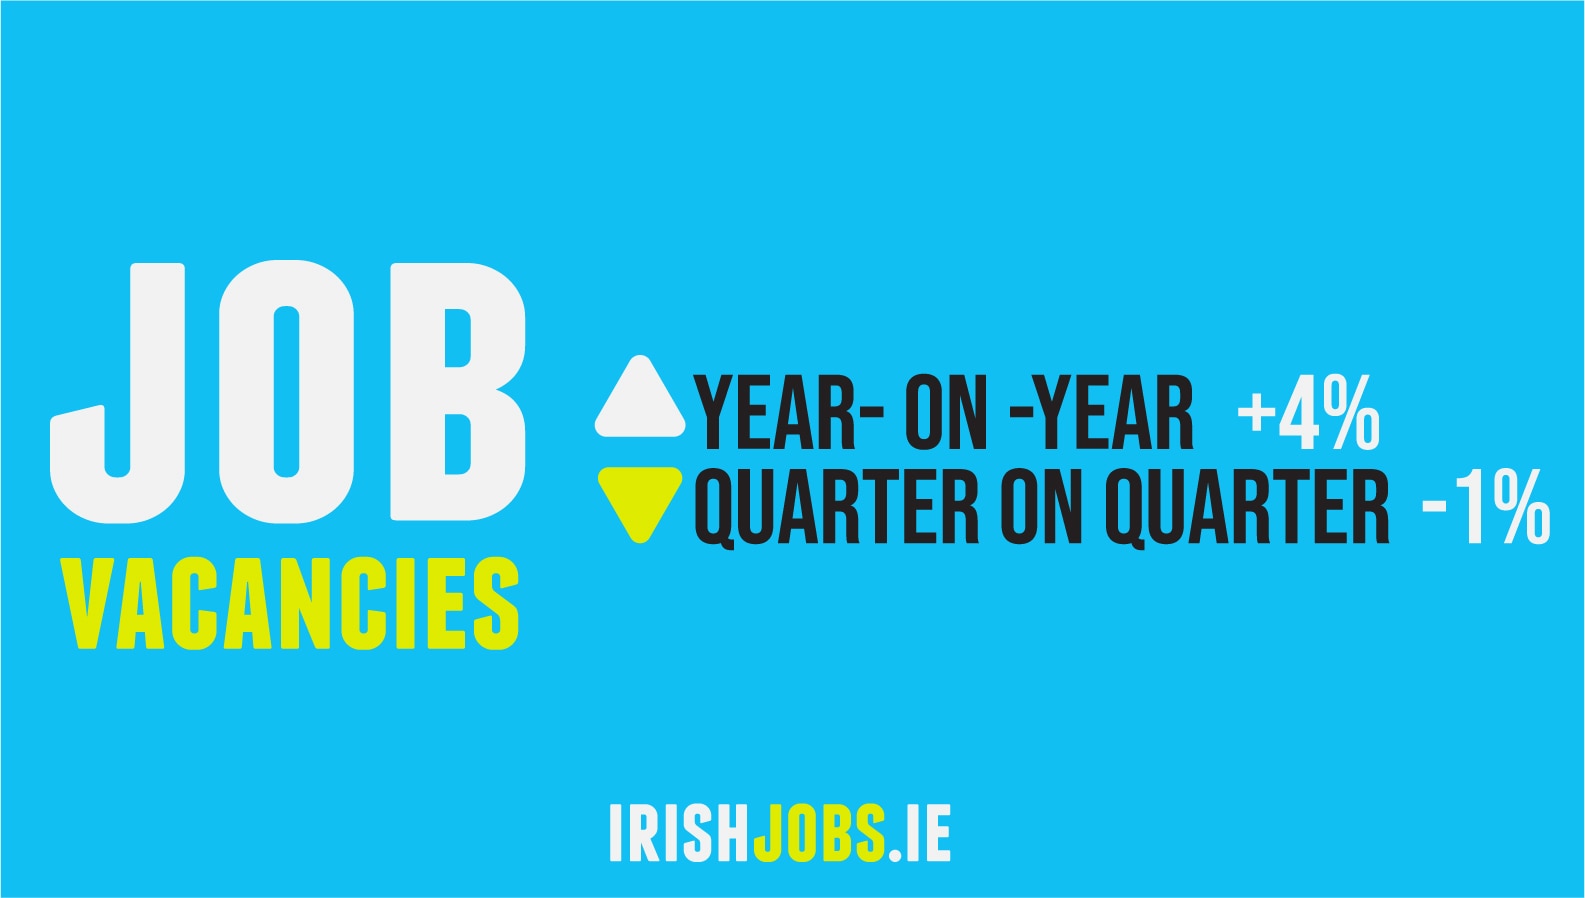
According to new data in the Q3 2018 edition of the IrishJobs.ie Jobs Index, job vacancies increased by +4% year-on-year.
Accountancy and finance recorded a +15% year-on-year increase in job vacancies and construction and property a +8% increase.
IrishJobs.ie’s two high-tech industry case studies, medical professionals and healthcare and science, pharmaceuticals and food, continue to perform well (+28% and +9% increases in vacancies, respectively) and reflect Ireland’s preeminent status as a global centre for pharmaceuticals and medtech.
On a geographical level, every county in the Republic of Ireland bar three recorded a year-on-year increase in job vacancies in Q3 2018.
In Dublin, vacancies increased by +19%, in Cork by +5%, and in Limerick by +2%; in rural counties, like Monaghan and Longford, vacancies increased +49% and +18%.
These results are open to interpretation, simultaneously positive and potentially negative depending on context. On the one hand, more job vacancies indicate that Ireland’s economy remains on an upwards trend. Businesses are confident, investing in growth, and in doing so, creating jobs.
A problem arises if these vacancies are not filled. This can be a short-term issue, particularly if an area is the recipient of new, rapid investment and growing faster than vacancies can be filled.
Ireland is approaching full employment. While a welcome change from the jobs market of ten years ago, this situation poses its own challenges. The labour market is tight and businesses are in a ferocious competition over talent. There is only so much to go around.
There are two main solutions to this. The first is to ensure that Irish workers have access to training in skills demanded by a high-tech, globalised economy. This requires investment from the State and from private industry. Second- and third-level institutions must develop skillsets that are relevant, adaptable and transferable.
It is in a business’s interest, too, to invest in continued professional development, either through an internal education programme or by encouraging employees to enrol in courses. Employers need to look at their skills training and professional development programmes as a key component to attracting and retaining the right candidate.
The second is to make it easier for companies to import overseas talent to plug long-lasting or urgent gaps, potentially through some sort of visa waiver programme if this talent is outside the EU. When there is no way to fill vacant roles in Ireland, employers will need to look further afield to find the right talent and the process for filling these gaps with international candidates should be made as quick and simple as possible.
Ireland is in a strong position. Economically, we are performing well in virtually every sector, especially in high-tech, highly skilled industries. However, two barriers remain Brexit, which we can only prepare for, and the talent gap, which policymakers and entrepreneurs must tackle together.
Orla Moran
General Manager, IrishJobs.ie
Irish jobs — the national outlook
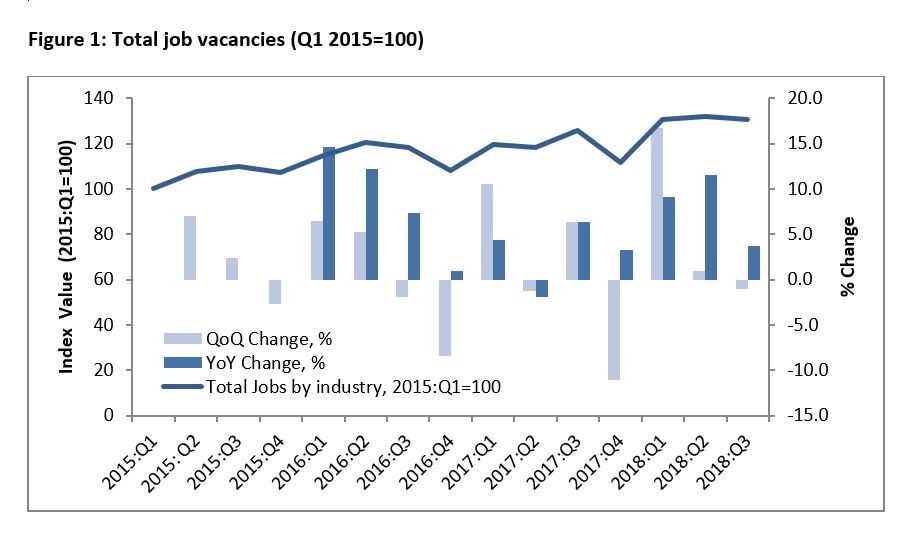
IrishJobs.ie data for Q3 2018 reveal a +4% year-on-year increase in total job vacancies, with quarterly job vacancies down -1% from Q2 2018. The +4% year-on-year increase maintains the high level of vacancy generation evident throughout 2017 and across the first half of 2018.
The quarterly growth rate has fallen back slightly (-1%) from Q2 2018. Given the variability generally associated with quarterly data, it may be premature to deem this as being indicative of an imminent softening in vacancy creation. While the IrishJobs.ie Jobs Index has reached a plateau in recent quarters, year-on-year growth remains robust.
By way of context for this IrishJobs.ie quarterly report, we provide a brief synopsis of prevailing Irish economic conditions.
The latest ESRI Autumn Quarterly Economic Commentary reports another strong performance this year for the Irish economy, with GDP estimated to have grown by +8.9% in 2018. Strong domestic consumption, along with falling imports, have contributed to this robust GDP growth.
Total Irish exports have increased at an annual rate of +9.7%, while imports have fallen by -5.7%. On an annualised basis, personal consumption increased by just under +5% in Q2 2018. In year-on-year terms, retail sales are up +5.8% on 2017.
Labour, skills and wages
The Irish labour market also continues to perform very strongly. Employment levels for the first half of 2018 have surpassed previous records. The seasonally adjusted figures for employment in the Irish economy continue to increase, with an additional 74,700 jobs generated in the year to Q2 2018 (+3.4%).
The largest year-on-year growth rates were recorded in the construction (+13.7%), accommodation and food (+10.9%) and administrative and support service activities (+8.7%) sectors.
Seasonally adjusted unemployment fell to 5.6% in August 2018. The number of people out of work continued to decline. On a seasonally adjusted basis, the Live Register recorded a decrease of 28,600 (-8.6%) between January and August 2018, resulting in a seasonally adjusted total of 209,900 people out of work. Initial figures for 2018 show a continuation of these positive trends. The occupational group with the largest number of people on the Live Register is still the (construction related) craft sector. However, this sector did register the largest decrease over the past year, declining by -18.9%.
The CSO Labour Force Survey provides estimates of regional level unemployment rates. Over the past year, Ireland has witnessed a substantial change in the spatial pattern of unemployment rates. In the second quarter of 2018, the Midlands region recorded the highest unemployment rate in the state (9.7%), while the lowest rates were recorded in the Dublin (5.3%) and the South-West (5.3%) regions.
Participation in the labour force continues to improve, with labour market shortages beginning to emerge in various sectors. The ESRI links the disparities in employment rates and other labour market outcomes across individuals with different educational backgrounds to a possible skills mismatch in the Irish economy.
Growth in employment appears to be contributing towards increased wage pressures in the Irish economy, as average earnings continue to grow. On an annual basis, average hourly earnings increased by +2.4% in Q2 2018. The largest increase in that quarter was observed in financial, insurance and real estate activities, rising annually by +4.3%. Other notable increases occurred in construction (+4.3%), ICT (+4.2%) and education (+3.6%). The ESRI expects nominal earnings to continue this increase, rising by +2.8% in 2018.
Job Vacancies by sector

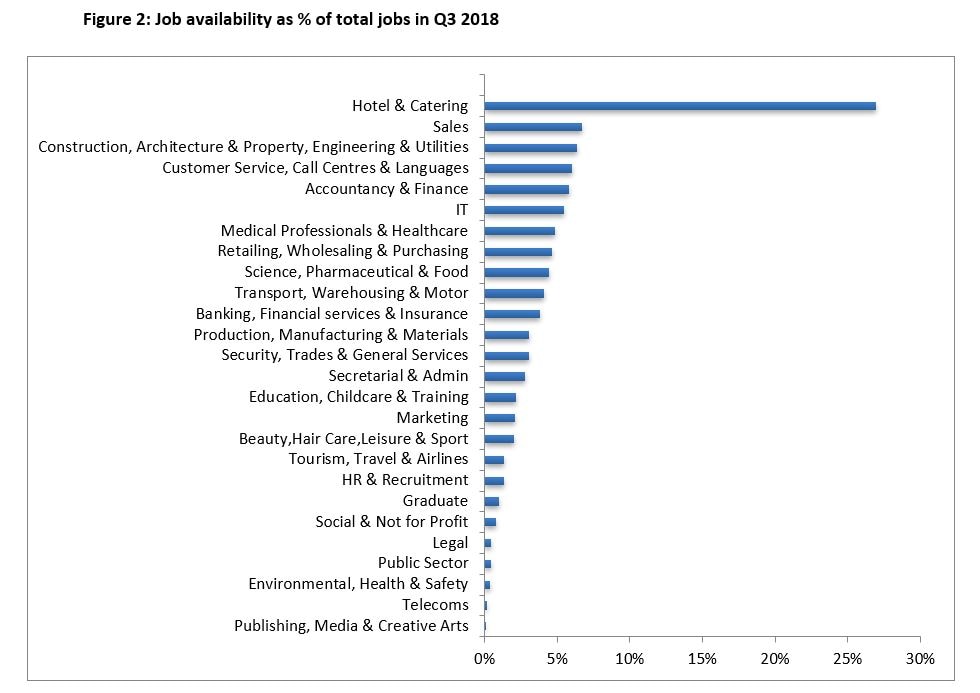
Figure 2 (below) provides a snapshot of the proportion of job vacancies generated by individual sectors in Q2 2018.
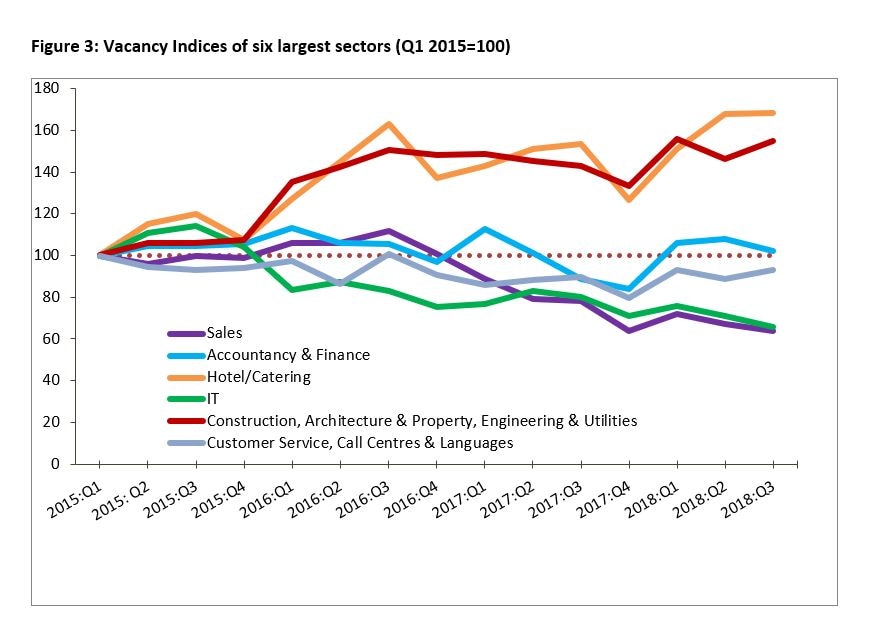
The largest six sectors, in terms of share of vacancies generated in Q3 2018, are Hotel & Catering (27%); Sales (7%); Construction, Architecture & Property, Engineering, and Utilities (6%); Customer Service, Call Centres & Languages (6%); Accountancy and Finance (6%); and IT (5%).
The performance of these six sectors over time, from Q1 2015 to Q3 2018, is illustrated in Figure 3. As illustrated in Figure 3, two of these sectors in particular have exhibited a strong upward trend in vacancy creation across the last three years: the Hotel & Catering sector and the Construction, Architecture & Property, Engineering, and Utilities sector (current index values: 168 and 155, respectively).
Two other sectors, the Accounting and Finance sector and the Customer Services, Call Centres, and Languages sector have experienced some variability across recent years but have enjoyed a more positive performance in recent quarters and, in year-on-year terms, have increased by +15% and +4% respectively. However, Sales and IT appear to have lost some ground in recent quarters, with both quarterly and year-on-year figures residing in negative territory.
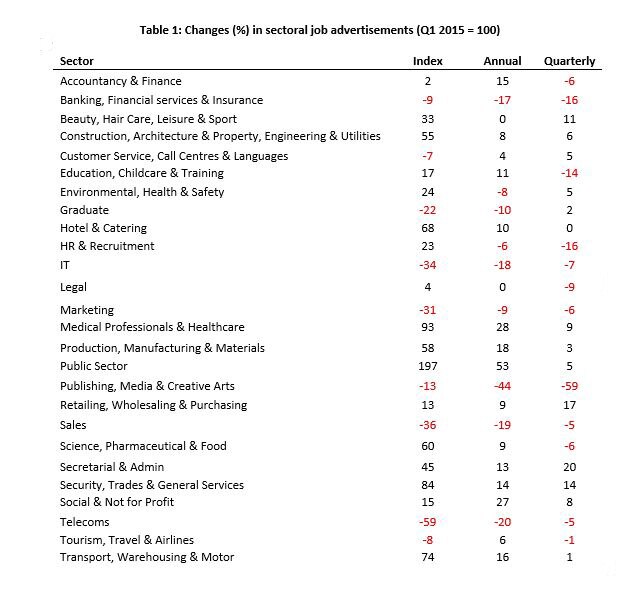
 In order to consider this sectoral dimension of Q3 2018 job vacancy trends in further detail, Table 1 (below) sets out a breakdown vacancy rates across 26 sectors. At this sector-specific level, a number of distinct trends are evident. The largest annual increases have been experienced in Public Sector jobs (+53%); Medical Professionals and Healthcare (+28%); Social and Not for Profit (+27%); Production, Manufacturing, and Materials (+18%); and Transport, Warehousing, and Motors (+16%).
The largest annual declines in the index can be seen in Publishing, Media, and Creative Arts (-44%); Telecoms (-20%); Sales (-19%); and IT (-18%).
Strong quarterly growth for Q3 2018 is evident in a relatively small set of sectors, which include Secretarial and Admin (+20%); Retailing, Wholesaling, and Purchasing (+17%), and Security, Trades and General Services (+14%).
A number of prominent quarterly declines are also evident in Table 1, including Publishing, Media, and Creative Arts (-59%); HR and Recruitment (-16%); and Banking, Financial Services & Insurance (-16%).
Medical & Science – a health check for Irish employment
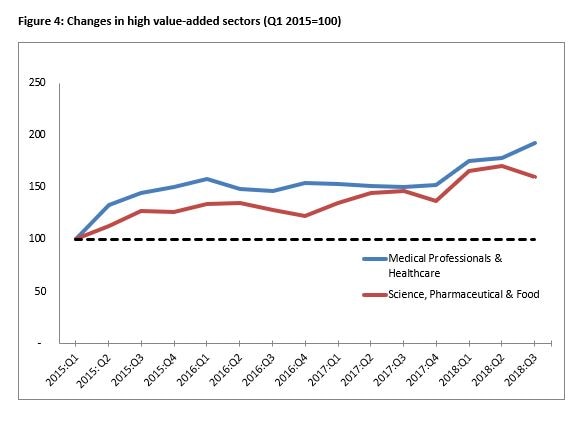
As per previous IrishJobs.ie quarterly reports, we present the vacancy rates of two high-skill, high value-added sectors (Medical Professionals and Healthcare; Science, Pharmaceutical and Food) as useful barometers of the Irish employment outlook.
The trends evident in the vacancy growth rate of these two sectors resonates with that of our overall index (Figure 1) and our sectoral analysis: clear year-on-year growth from Q3 2017 to Q3 2018, but a less conclusive quarterly story.
Both the Medical Professionals and Healthcare sector and the Science, Pharmaceutical and Food sector have exhibited strong year-on-year increases in vacancies generated (+28% and +9%, respectively). However, while the Medical Professionals and Healthcare sector has enjoyed a quarterly growth rate of +9%, the Science, Pharmaceutical and Food sector has posted a quarterly decline of -6%.
Job vacancies by location

As regards vacancy gains by location, the quarterly increase in vacancies at the national level is underpinned by a range of experiences at county level. All but five counties experienced a rise in vacancies over the third quarter.
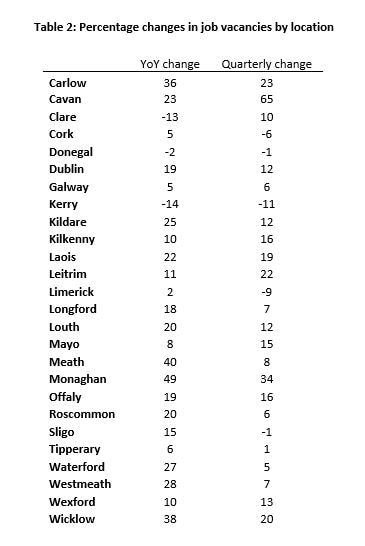
The strongest quarter-on-quarter vacancy increase has been recorded in Cavan (+65%). Other counties that experienced substantial gains include Monaghan (+34%), Carlow (+23%) and Leitrim (+22%). This contrasts with relatively strong falls in Kerry (-11%) and Limerick (-9%).
The year-on-year figures present a more limited range of experiences. All but three counties experienced an increase in vacancies. The strongest year-on-year gains are recorded in Monaghan (+49%), Meath (+40%) and Wicklow (+38%). The strongest falls are recorded in Kerry (-14%) and Clare (-12%)
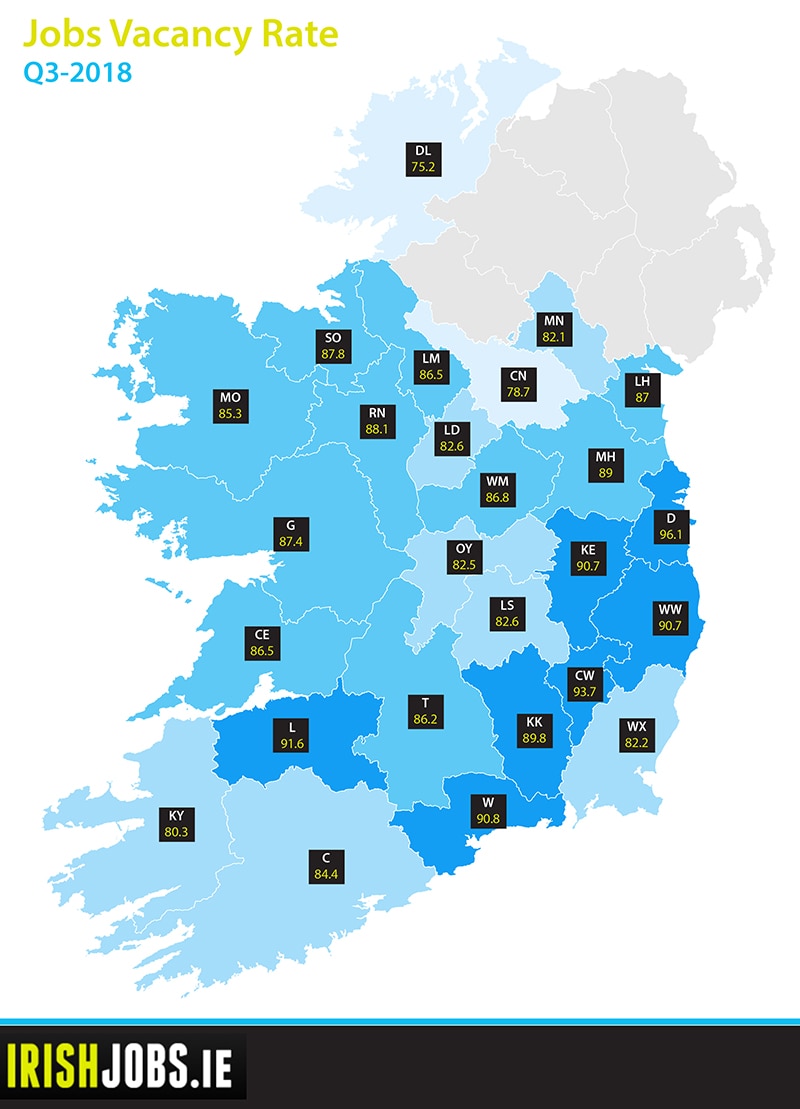
This IrishJobs.ie Jobs Index also presents an indicator in order to provide an insight into the relative importance of the number of vacancies across locations. The indicator used–the job vacancy rate–is the official indicator used by Eurostat, the statistical office of the European Union.
It measures the proportion of total positions that are vacant in a given location expressed as a proportion of total employment in that location combined with job vacancies (for details, see methodological note).
The results for Q3 2018 are mapped in Figure 5. As in the previous quarter, the highest job vacancy rates have been recorded in Dublin (96.1), Carlow (93.7) and Limerick (91.6).
This contrasts with the notably lower rates evident in traditionally economically peripheral counties such as Donegal (75.2), Cavan (78.7) and Kerry (80.3).
Compared to the second quarter in 2018, all but five counties have experienced an improvement in their job vacancy rate, with the greatest percentage increase evident in Cavan (+13.9%) and Monaghan (+6.1%). Kerry (-2.1%), Cork (-1.0%) and Limerick (-0.8%) exhibit the greatest quarterly falls in vacancy rates.
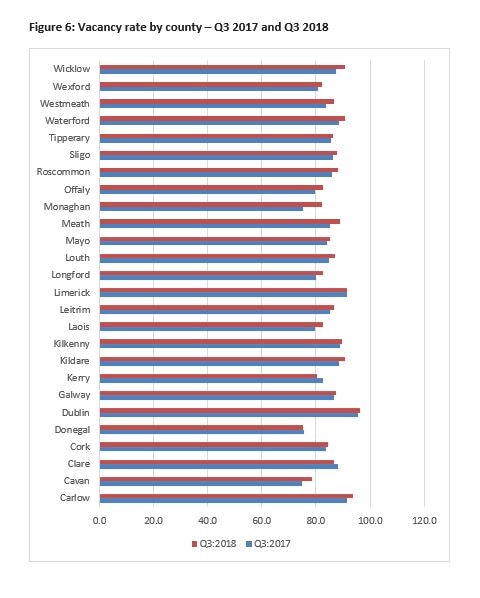
Figure 6 presents the year-on-year changes in the vacancy rates. Monaghan has made the strongest gain in vacancy rate (+8.9%) followed by Cavan (+5.0%). Falls were recorded in Kerry (-2.8%), Clare (-1.7%) and Limerick (-0.5%).
The implications of low or high vacancy rates depend on the specific labour market context, notably the unemployment rate. Ignoring dynamics in the size of the labour force, the labour force participation rate, and inter-county commuting, we can distinguish four situations:
1. Firstly, low vacancy rates may occur in areas with relatively high unemployment rates. This is clearly an undesirable situation, suggesting a general economic crisis or a structurally lagging region.
2. Secondly, probably less common, high vacancies may coincide with low unemployment rates. This could be suggestive of a tight labour market that can be observed in localities experiencing economic expansion. Depending on one’s perspective, this could be interpreted as a negative or positive situation, although in the medium term the region runs the risk of wage inflation.
3. Thirdly, low vacancies may coincide with low unemployment rates. Arguably, this is the most benign situation.
4. The final situation is characterised by a high vacancy rate and high unemployment. This could reflect a mismatch between the education/skills profile of the labour force and employers’ requirements. Such situations occur in areas undergoing industrial restructuring.
Dublin and Limerick, two counties residing among those with the highest vacancy rates, are characterised by differing situations.
 In light of the low and falling levels of unemployment in Dublin we may surmise that this county is at risk of experiencing situation 2, involving a combination of high vacancy rates, low unemployment, and the concomitant emergence of wage inflation.
 In contrast, the high and rising vacancy rate of Limerick occurs in a context of a relatively high unemployment rate. This is suggestive of a mismatch between the education/skills profile of the labour force and employers’ requirements in a region that is undergoing a process of industrial restructuring.
Conclusion
As a timely indicator of the workings of the Irish economy, the IrishJobs.ie Jobs Index provides insights into Irish job vacancy generation on both a quarterly and year-on-year basis. The Q3 2018 IrishJobs.ie Jobs Index reveals continued year-on-year growth in the generation of job vacancies (+4%). The IrishJobs.ie vacancy index has reached a plateau in recent quarters, albeit at a high level, and the quarterly growth rate has fallen back slightly (-1%). While a minor quarterly fluctuation is not sufficient grounds for pessimism, it does caution against complacency.
In terms of location, the quarterly increase in vacancies at the national level reflects a mix of dynamics at county level. The strongest quarter-on-quarter vacancy increase has been recorded in Cavan (+65%). This contrasts with relatively strong falls in Kerry (-11%) and Limerick (-9%). The year-on-year figures range from growth rates of +49% for Monaghan to -14% for Kerry. Dublin, Carlow and Limerick are recording the highest job vacancy rates, while Donegal, Cavan and Kerry record the lowest job vacancy rates.
A note on the data
The report utilises a dataset comprising of all corporate jobs advertised on IrishJobs.ie and Jobs.ie from 1 July 2018 to 30 September 2018. Revisions to the data-gathering process mean that this figures stated in this report are not directly comparable to previous reports.
Vacancy rate by location
To obtain an insight into the relative importance of the number of vacancies in specific locations, we use the official Eurostat indicator: the job vacancy rate. The indicator, as defined by Eurostat, is calculated as the number of job vacancies divided by the numbers in employment plus the number of vacancies (job vacancy rate = number of job vacancies / numbers in employment (in thousands) + number of job vacancies * 100).
Data pertaining to numbers in employment is available from the Quarterly National Household Survey. The QNHS provides employment figures at the level of the eight spatial planning regions in Ireland. The number employed per county has been estimated by applying the proportional distribution of employment across the counties in a given planning region, as reported in the latest CSO population census (2016).
This report, commissioned by IrishJobs.ie, is authored by economists Dr Declan Curranof Dublin City University and economic geographer, Dr Chris Van Egeraat.