The Q1 2019 IrishJobs.ie Jobs Index reveals a healthy jobs market supported by a robust economy. However, while quarter-on-quarter vacancies rose by +7%, a -1% year-on-year decrease in vacancies shows that nervousness around Brexit is affecting hiring.
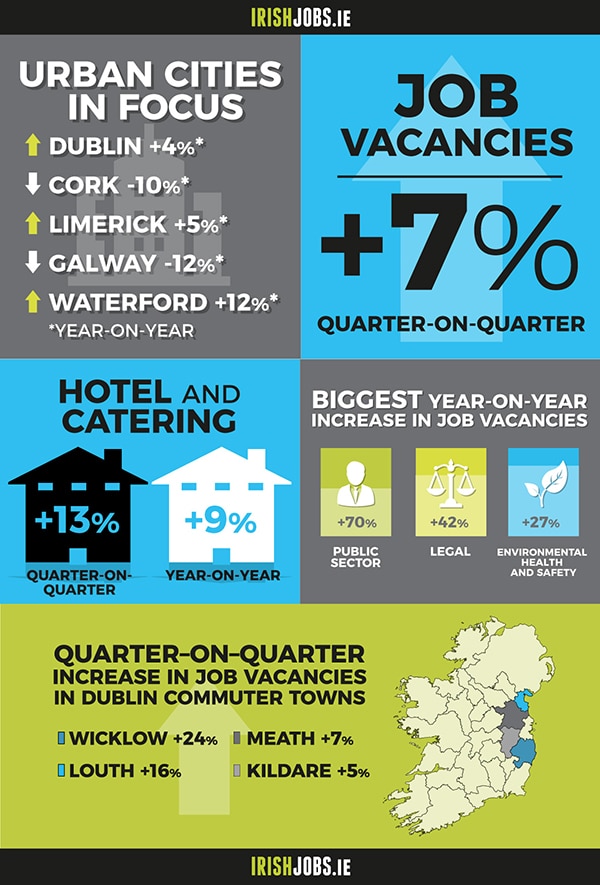
Tourism continues to be one of Ireland’s strongest performing sectors–this is hardly surprising considering 2018 was Ireland’s best ever year for overseas visitor numbers. Job advertisements in the hotel and catering sector increased by 9% year-on-year and 13% quarter-on-quarter. These figures will make for encouraging reading for those who feared the rise in VAT rates for the hospitality sector from 9% to 13% in Budget 2019 would hurt business performance and lead to job losses, particularly outside Dublin.
Construction had the third-largest share of vacancies in Q1 2019 (6%). While there were quarterly and annual decreases in new construction job advertisements, the growing need for residential and commercial property, particularly in Dublin, is likely to benefit the sector for the foreseeable future.
While the overall outlook is good, some sectors have been less fortunate. Jobs in marketing and in sales declined by -16% and -17% year-on-year, respectively. Typically, when an economy is performing well, the opposite occurs. Whether this trend continues into 2019 and 2020 remains to be seen.
Regional figures are generally positive and may suggest that the economy’s near total dependence on the success of Dublin is decreasing, albeit slowly. Consistent, steady increases in quarterly numbers were recorded in Kerry, Clare, Wicklow and Roscommon. Some decreases, particularly in Cork and Galway, are surprising and warrant further observation over the long term.
Ireland’s economic outlook remains largely unchanged from Q4 2018. Despite the interminable length of Brexit negotiations, businesses should not forget how a sudden or nasty UK-EU divorce could affect their access to talent; contingency plans are essential. Euroscepticism, too, is on the rise across the bloc, and European elections in May could produce a different, less open parliament.
At home, we must remain cognisant of the challenges of a mature economy. We are at virtually full employment. How can we ensure that businesses have access to the skills that will allow them to continuously innovate? This will depend on our ability to keep our education curricula flexible and modern, and our openness to foreign workers who can plug immediate talent deficits.
Orla Moran
General Manager, IrishJobs.ie
Irish jobs: the national outlook
IrishJobs.ie data for Q1 2019 reveal a +7% quarterly increase in total job vacancies, with year-on-year job vacancies having declined by -1%.
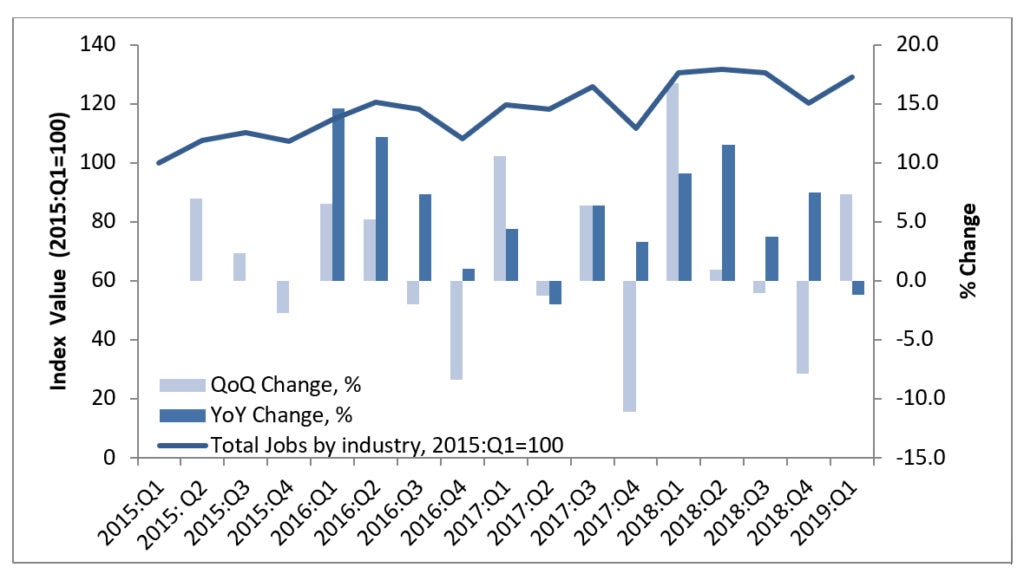
This +7% quarterly increase in Q1 2019 sees the overall index regain ground lost in Q4 2018 and return to a level (129 index points) just shy of the high plateau at which the index resided throughout the first three quarters of 2018.
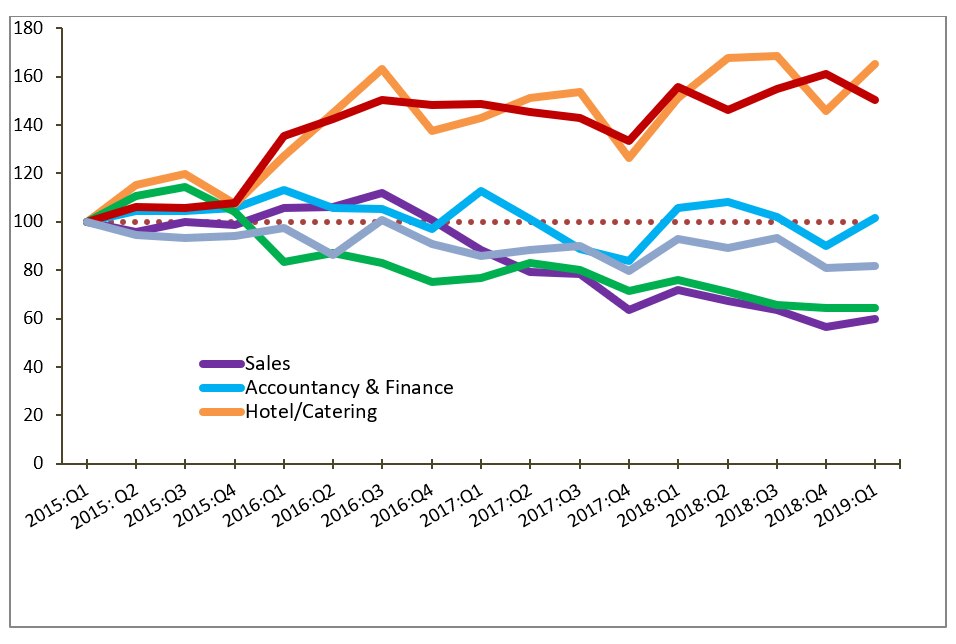
Figure 1: Total Job Vacancies (Q1 2015 = 100)
In order to set the scene for the current IrishJobs.ie quarterly report, we provide a brief synopsis of prevailing Irish economic conditions. The latest ESRI Spring Quarterly Economic Commentary reports another strong performance for the Irish economy in 2018, with GDP estimated to have grown by +6.7%.
Total Irish exports have increased at an annual rate of +9.3%, while imports increased by +22.3%. On an annualised basis, personal consumption expenditure increased by +2.6% in Q4 2018. In year-on year terms, retail sales are up +4.4% on Q4 2017.
The Irish labour market continues to perform dynamically. The seasonally adjusted figures for employment reveal continued growth in the number of people working in the Irish economy, with an additional 50,000 jobs generated in the year to Q4 2018. In Q4 2018, employment increased by +7.9% in the construction sector, +3.7% in the accommodation and food service sector, +1% in the wholesale and retail trade sector and +0.3% in the financial, insurance and real estate sector.
The number of people out of work continued to decline. On a seasonally adjusted basis, the Live Register recorded a decrease of 37,800 between January 2018 and January 2019, a fall of -15.9%. From August 2018 to January 2019 the unemployment rate has remained fixed at 5.7%. The CSO Labour Force Survey provides estimates of regional level unemployment rates. Over the past year, Ireland has witnessed a substantial change in the spatial pattern of unemployment rates. In Q4 2018, the South-East region recorded the highest unemployment rate in the state (7.7%), while the lowest rates were recorded in the Border (3.8%), Mid-East (4.9%) and Dublin (5.0%) regions.
The labour force participation rate remained at 62.2% in Q4 2018, the same rate as it had been in Q4 2017. Growth in employment appears to be contributing towards increased wage pressures in the Irish economy, as average earnings continue to grow. In Q4 2018, seasonally adjusted average hourly earnings increased by +3.5% relative to the same period in 2017. The largest increase for the quarter was observed in the mining and quarrying sector, rising annually by +11.8%. This was followed closely by the transportation and storage sector, which rose by +10.3%. Other notably high increases occurred in other service activities (+7.8%) and administrative and support services (+7.5%).
Job vacancies by sector
Figure 2 (below) provides a snapshot of the sectors that generated the largest share of job vacancies in Q1 2019. The largest six sectors, in terms of proportion of vacancies generated in Q1 2019, are hotel and catering (27%); accountancy and finance (6%); construction, architecture and property, engineering, and utilities (6%); sales (6%); IT (5%); and customer service, call centres and languages (5%).
The performance of these six sectors over time is illustrated in Figure 3, which tracks the vacancy indices of these sectors from Q1 2015 up to Q1 2019. Over this period, two sectors in particular–the construction, architecture and property, engineering, and utilities sector and hotel and catering sector–maintained an overall upward trajectory.
The hotel and catering sector has posted a quarterly increase in its vacancy rate (+19) in Q1 2019, reversing a dip in Q4 2018. The construction, architecture and property, engineering, and utilities sector has retreated somewhat from its strong performance in previous quarters, with its vacancy index shedding 3 points in quarterly terms and 7 points in year-on-year terms.
Of the remaining significant sources of vacancy generation, two sectors–the accounting and finance sector and the sales sector–have posted quarterly increases in vacancies (+13 and +6 index points, respectively), though both are down in year-on-year terms (-4 and -17 index points, respectively). The customer services, call centres, and languages sector and the IT sector both exhibit minimal quarterly movement (+1 and 0 index points, respectively) and noticeable declines in year-on-year terms (-12 and -15 index points, respectively).
Figure 2: Job availability as % of total jobs in Q1 2019
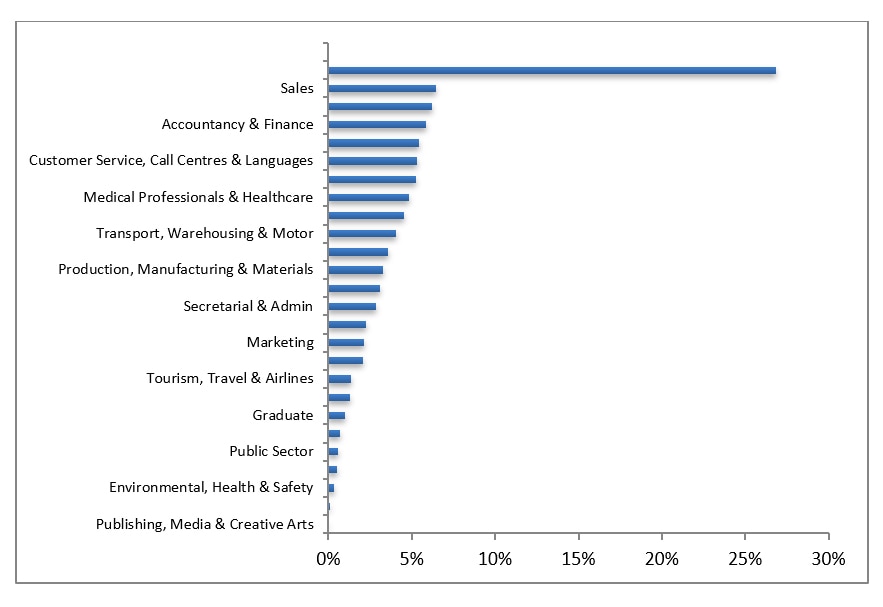
Figure 3: Vacancy Indices of six largest sectors (Q1 2015=100)
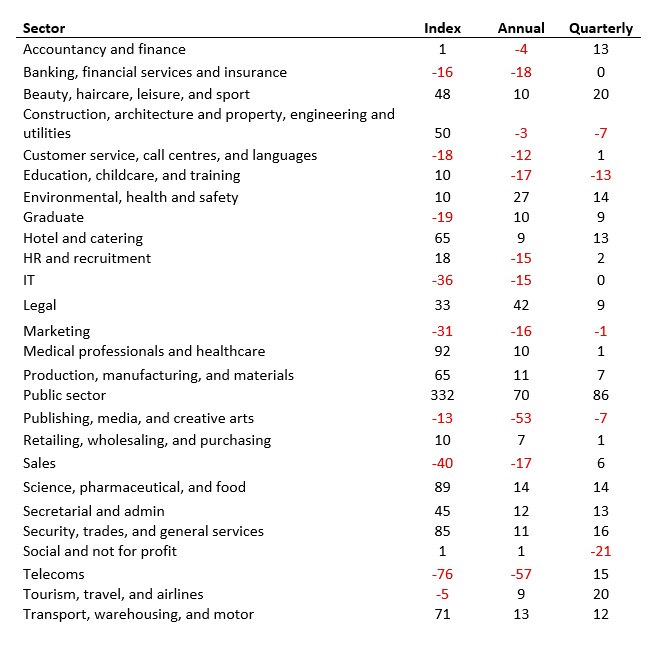
Further insights into the distinct sectoral trends evident in Figures 2 and 3 can be gleaned from Table 1 (below), which provides a detailed breakdown of Q1 2019 job vacancy trends across 26 sectors.
In terms of year-on-year changes, the sectoral breakdown reveals something of a mixed picture. While 15 sectors post year-on-year increases in job vacancies, 11 sectors post declines. The largest increases are evident in public sector (+70%); legal (+42%); and environmental, health and safety (+27%). A number of sectors post smaller increases, within the 10-14% range (such as science, pharmaceutical, and food (+14%); secretarial and admin (+12%); production, manufacturing, and materials (+11%), and security, trade, and general services (+11%). Of the 11 sectors that post year-on-year declines, the most notable annual declines are evident in telecoms (-57%); and publishing, media, and creative arts (-53%). The other sectors posting annual declines reside mainly in the 10-20% range, including education, childcare, and training (-17%); sales (-17%); and IT (-15%); and HR and recruitment (-15%).
The quarterly changes in sectoral vacancies paints a relatively more positive picture: 19 sectors post quarterly increases in vacancies, with a further two posting no change, and five sectors declining. Notable increases include public sector (+86%); beauty, haircare, leisure, and sport (+20%); and tourism, travel, and airlines (+20%). A further 11 sectors boast quarterly increases in vacancies within a range of 6% and 15%. At the upper end of this range are security, trade, and general services (+16%); science, pharmaceutical, and food (+14%); and environmental, health, and safety (+14%). Of the five sectors to post quarterly declines in vacancies generated, the most prominent are social and not for profit (-21%); and education, childcare, and training (-13%).
Table 1: Changes (%) in sectoral job advertisements (Q1 2015 = 100)
Medical & Science: a health check for Irish employment
Figure 4: Changes in high value-added sectors (Q1 2015 = 100)
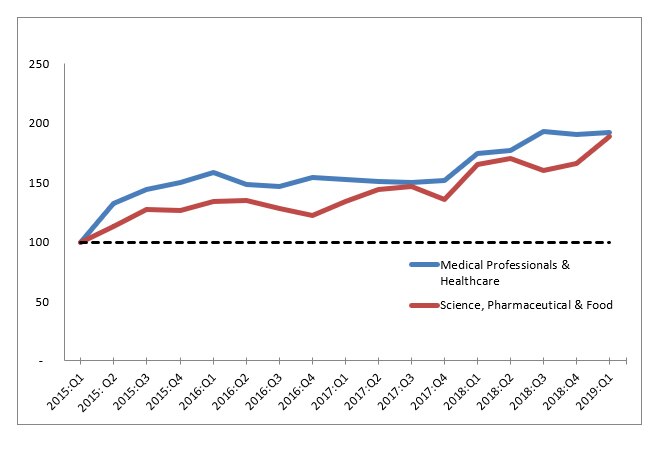
As has been the custom in our previous IrishJobs.ie quarterly reports, we present the vacancy rates of two high-skill, high value-added sectors (medical professionals and healthcare; and science, pharmaceutical and food) as prescient indicators of the Irish employment outlook.
The pharmaceutical and food sector has performed particularly well both on a quarterly and year-on-year basis, with vacancies increasing by +14% both for the quarter and relative to Q1 2018.
This suggests that internationally traded sectors such as the pharmaceutical and food sector have thus far remained robust in the face of international economic uncertainties. The medical professionals and healthcare sector has also performed strongly in year-on-year terms (an increase in vacancies of +14%), while increasing at a more modest rate (+1%) for the quarter. While these figures are both in positive territory, this relatively modest quarterly growth in medical professionals and healthcare sector vacancies has been apparent since Q3 2018.
Job vacancies by location
Table 2: Percentage changes in job vacancies by location
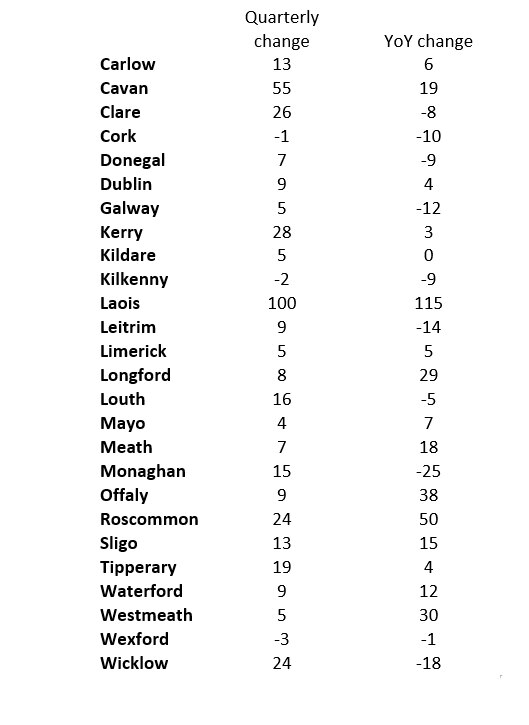
As regards vacancy gains by location, the quarterly increase in vacancies at the national level reflects a range of experiences at county level.
All but three counties experienced a rise in vacancies over the first quarter. The strongest quarter-on-quarter vacancy increases have been recorded in Laois (+100%) and Cavan (+55%). The strong increase in Laois should be interpreted in the context of the small number of vacancies in that county.
Other counties that experienced substantial gains include Kerry (+28%), Clare (+26%), Wicklow (+24%) and Roscommon (+24%). This contrasts with relatively modest falls in Wexford (-3%) Kilkenny (-2%) and Cork (-1%). In relation to the main cities, Dublin (+9%), Galway (+5%) and Limerick (+5%) all experienced a rise in vacancies while Cork experienced a small fall (-1%).
The year-on-year figures present an equally wide range of experiences. Ten counties recorded a fall in vacancies, with the strongest decreases recorded in Monaghan (-25%), Wicklow (-18%) and Leitrim (-14%). But a substantial number of counties experienced strong positive performances. The highest year-on-year increase has been observed in Laois (+115%). Here to, the strong increase reflects a relatively low number of vacancies in the base quarter. Other counties recoding strong gains include Roscommon, Offaly and Westmeath, all recording increases of +30% or more. Focusing on the main cities, Dublin (+4%) and Limerick (+5%) experienced small increases in vacancies while Galway (-12%) and Cork (-10%) experienced job numbers fall back.
Conclusion
The IrishJobs.ie Jobs Index provides a timely indicator of Irish job vacancy generation on both a quarterly and year-on-year basis. This edition reveals strong quarterly performance (+7% increase in vacancies for the quarter).
However, at a sectoral level there are some contrasting trends. Internationally traded sectors–such as the science, pharmaceutical, and food sector–have continued to perform strongly. Tourism sectors, such as hotel and catering, have also maintained robust growth in vacancies. However, of the 26 sectors analysed in this report, 11 posted year-on-year decreases in vacancy creation. This may be indicative of a softening in sectors with a greater reliance on domestic consumption.
In terms of location, the quarterly increase in vacancies at the national level reflects a mix of dynamics at county level. The year-on-year figures range from growth rates with good job growth in regions outside the capital.
A note on the data
The report utilises a dataset comprising of all corporate jobs advertised on IrishJobs.ie and Jobs.ie from 1 January 2019 to 31 March 2019. Revisions to the data-gathering process mean that the figures stated in this report are not directly comparable to previous reports.
This report, commissioned by IrishJobs.ie, is authored by economists Dr Declan Curran of Dublin City University and economic geographer, Dr Chris Van Egeraat.