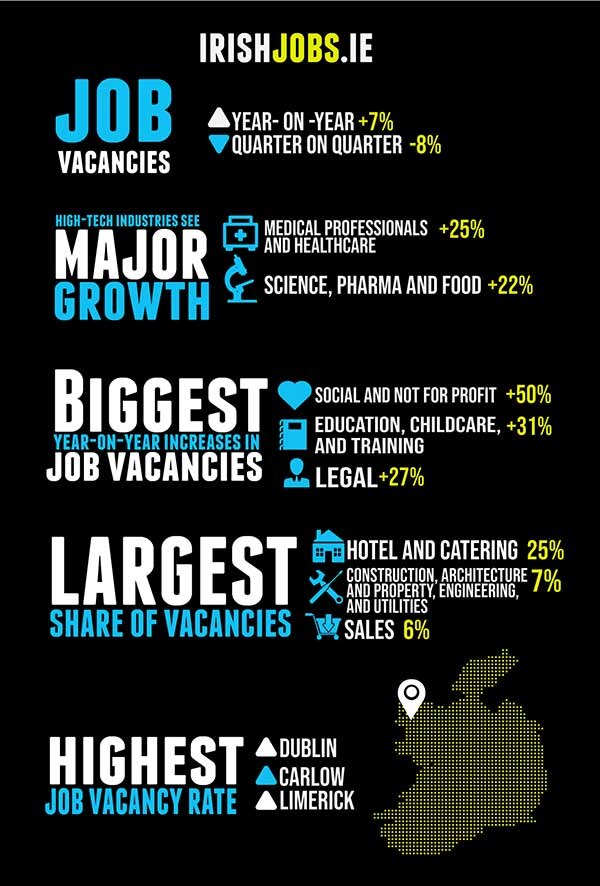
The Irish economy is strong. Job vacancies were up +7% in Q4 2018 compared to the same period in 2017, and in two of Ireland’s most high-tech industries, medical professionals and healthcare and science, pharmaceutical and food vacancies increased by +25% and +22% year-on-year, respectively.
The construction sector resisted a quarter-on-quarter slowdown (a typical trend in Q4) and grew by +4% on Q3 2018 and +21% year-on-year; evidently, the demand for new housing and commercial developments, and the skilled professionals required to build them, has not slowed.
However, the future of the Irish economy–and with it, the health of the jobs market–is far from certain.
Brexit still remains the great unknown for Irish employers. By the time the next IrishJobs.ie Jobs Index is published, the UK will have, legally at least, left the EU. The potential for a no deal Brexit increases the closer we get to March 29th, meaning the UK will revert to WTO trading rules until it negotiates a new free trade agreement with the EU and other nation states. This will likely take years. From an Irish business and employment perspective, this disruption and delay will come with fresh implications, but also new opportunities.
The uncertainty will be particularly challenging for the agri-food industry, given that 37% of all food and beverage exports are to the UK.
There could be challenges for the Irish hospitality sector. Considering the huge importance of British visitors to the Irish tourism sector, and the decline in their numbers that follows any sterling fluctuation, the Government’s decision to raise the VAT rate on hospitality businesses could compound problems and negatively impact job creation. Only time will tell on this front.
However, some Irish industries will benefit from Brexit. The IDA announced earlier this month that more than 55 Brexit-related investments have been made by multinational companies, many in the financial services and banking sectors, creating more than 4,500 new jobs.
In addition, foreign direct investment in the Irish economy remains in rude health. In the last fortnight alone, tech giants Facebook and Salesforce have announced a combined 2,500 new roles in their Dublin operations.
However, despite a robust 2018, “preparedness” should be the operating philosophy of Ireland’s business community in 2019, one proactively backed and promoted by the State and its agencies. The Government must do everything in its power to maintain Ireland’s image as a reliable place to do business. In the private sector, to ensure continued job creation, organisational heads must prepare for maximum disruption while simultaneously looking to other markets other than the UK to grow their customer base and revenue opportunities.
Jane Lorigan
CEO Saongroup Europe, owner of IrishJobs.ie.
Irish Jobs – The National outlook
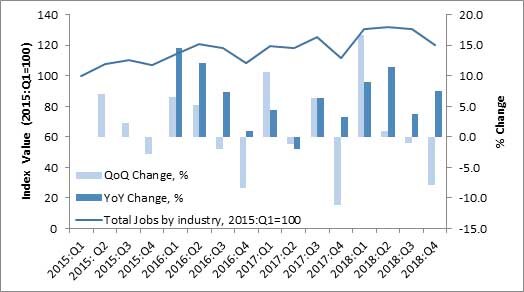
IrishJobs.ie data for Q4 2018 reveal a +7% year-on-year increase in total job vacancies, with quarterly job vacancies down -8% from Q3 2018.
Looking back over the year, Q1 2018 saw the index clear the 130-point mark for the first time in its history. This level was sustained in Q2 2018 and Q3 2018, as the index posted values of 132 and 130 respectively. After this robust performance across the first three quarters of 2018, the index has fallen back by -8% in Q4 2018 and ends the year at 120. Despite this quarterly fall, the index remains +7% higher than that observed in Q4 2017.
Figure 1: Total job vacancies (Q1:2015=100)
In order to set the scene for the current IrishJobs.ie Jobs Index, we provide a brief synopsis of prevailing Irish economic conditions. The latest ESRI Autumn Quarterly Economic Commentary notes that the Irish economy recorded another very strong performance in 2018, with underlying economic activity increasing by between +4.5% and +5%.
Furthermore, it appears that the growth profile in 2018 was a broadly balanced one, with both domestic and external sources of growth contributing to the overall economic performance. The value of goods and service exports in Q2 2018 increased at an annual rate of +11% while imports fell by -6%.
The Irish labour market continued to perform strongly in Q3 2018. Employment levels for the first half of 2018 surpassed previous records. The seasonally adjusted figures for employment in the Irish economy continue to increase, with 66,700 jobs being added in the year to Q3 2018 (+3%).
The largest year-on-year growth rates were recorded in the construction (+14.1%), administrative and support service (+13.7%)and accommodation and food services (+10.1%) sectors. Elsewhere, agricultural employment decreased by -5.4% for the same period.
Seasonally adjusted unemployment fell to 5.3% in October 2018 and held firm at that level into December. The number of people out of work has continued to decline. On a seasonally adjusted basis, the Live Register recorded a decrease of 27,500 (-11.5%) between January and October 2018, resulting in a seasonally adjusted total of 210,700 people out of work. The number of people on the Live Register has fallen across all occupational groups over the last year.
The (construction-related) craft and related services sector represents the largest share of registered individuals, though this group also saw the largest year-on-year decrease (-19.4%) in people out of work.
The CSO Labour Force Survey estimates regional level unemployment rates. The regional unemployment rates tend to show substantial fluctuations from quarter to quarter. In Q3 2018, the South-East region had the highest unemployment rate in the country (8.6%), up from 7.2% in Q2. The lowest rates were recorded in the South-West (4.9%), Border (5.1%) and Dublin (5.3%) regions. Participation in the labour force continues to improve as labour market shortages begin to arise in various sectors.
Growth in employment appears to be contributing towards increased wage pressures in the Irish economy where average earning continue to grow. In Q3 2018, seasonally adjusted average hourly earnings increased by +2.6%. The largest increase was observed in ICT activities, rising annually by +4.6%. Other notably high earnings growth occurred in transport and storage, as well as in administrative services.
Job vacancies by sector
A snapshot of those sectors that generated the largest share of job vacancies in Q4 2018 is provided via Figure 2 (below).
The largest six sectors, in terms of share of vacancies generated in Q4 2018, are Hotel and Catering (25%); Construction, Architecture and Property, Engineering and Utilities (7%); Sales (6%); IT (6%); Customer Service, Call Centres and Languages (6%); and Accountancy and Finance (6%).
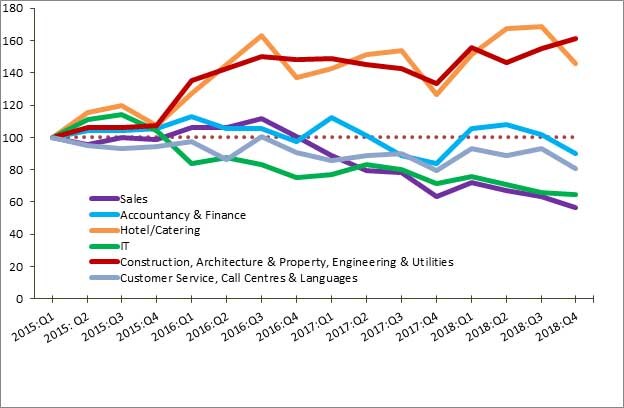
Figure 3 provides an overview of these sectors’ performance over the period Q1 2015 to Q4 2018.
As illustrated in Figure 3, one sector, in particular, the Construction, Architecture and Property, Engineering and Utilities sector has proved resistant to the quarterly slowdown documented by the overall index, posting growth of +21% in year-on-year terms and +4% for the quarter. The Hotel and Cateringsector has been the other strong performer across 2018, contracting by -13% in the final quarter of the year but still posting a +15% year-on-year increase on Q4 2017.
Two other sectors, the Accounting and Finance sector and the Customer Services, Call Centres, and Languages sector appear to mirror the trend evident in the overall index (Figure 1). Both enjoyed a strong performance across the first three quarters of 2018, but fall back somewhat in Q4 2018. The Accounting and Finance sector, in particular, grew by +7% in year-on-year terms, despite falling back by -12% in Q4 2018. Sales and IT continue their declines of recent quarters, with both quarterly and year-on-year figures residing in negative territory.
Figure 2: Job availability as % of total jobs in Q4 2018
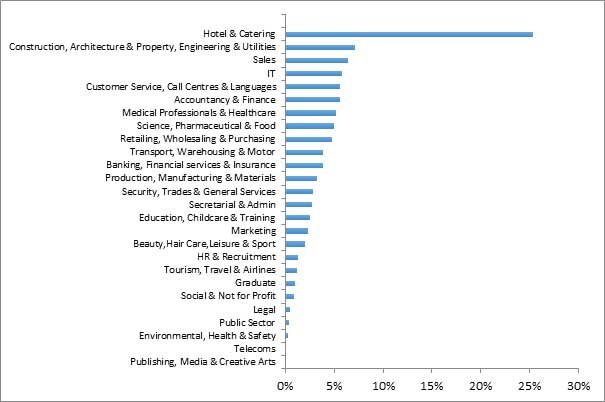
Figure 3: Vacancy Indices of six largest sectors (Q1 2015=100)
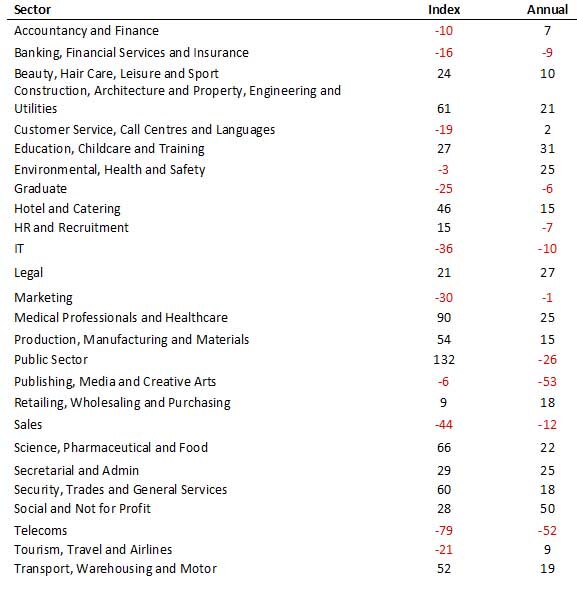
In order to further explore the distinct sectoral trends evident in Figures 2 and 3, Table 1 (below) sets out a detailed breakdown of Q4 2018 job vacancy trends across 26 sectors. At this sector-specific level, a number of distinct trends are discernible.
A number of sectors posted very strong year-on-year vacancy growth rates. The largest annual increases were experienced in Social and Not for Profit (+50%); Education, Childcare, and Training (+31%); Legal (+27%); Secretarial and Admin (+25%); Medical Professionals and Healthcare (+25%); Science, Pharmaceutical, and Food (+22%); and Construction, Architecture and Property, Engineering and Utilities (+21%).
That said, a small set of sectors posted notable annual declines, including Publishing, Media, and Creative Arts (-53%); Telecoms (-52%); Public Sector (-26%); Sales (-12%); and IT (-10%).
As noted above, the overall index was characterised by a quarter-on-quarter decline in Q4 2018 and this is also evident in the sectoral figures. Only seven sectors have posted quarter-on-quarter growth in Q4 2018. Among them, the largest increases are evident in Legal (+16%); Social and Not for Profit (+12%); and Education, Childcare, and Training (+8%).
A number of prominent quarterly declines are also evident in Table 1, including Telecoms (-49%); Public Sector (-22%); Environmental, Health, and Safety (-21%); Hotel and Catering (-13%); and Customer Service, Call Centres and Languages (-13%).
Table 1: Changes (%) in sectoral job advertisements (Q1 2015 = 100)
Medical & Science – a health check for Irish employment
Figure 4: Changes in high value-added sectors (Q1 2015=100)
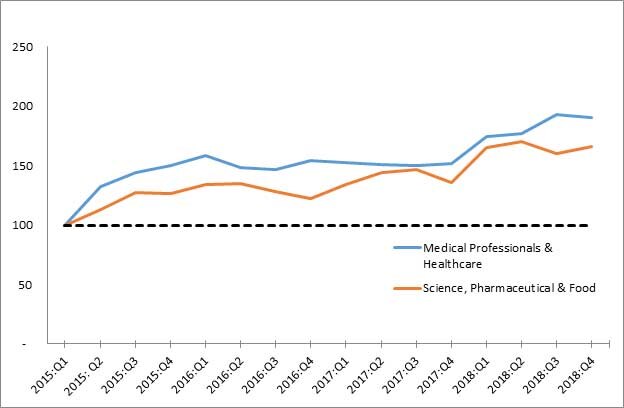
In keeping with previous IrishJobs.ie Jobs Indexes, we present the vacancy rates of two high-skill, high value-added sectors (Medical Professionals and Healthcare; Science, Pharmaceutical and Food) as insightful barometers of the Irish employment outlook.
Both the Medical Professionals and Healthcare sector and the Science, Pharmaceutical and Food sector have exhibited strong year-on-year increases in vacancies generated (+25% and +22%, respectively). As with the overall index, these sectors have evidently experienced a surge in vacancy generation across 2018.
That said, the sectors have recently experienced some quarterly variability: in Q3 2018 the Science, Pharmaceutical and Food sector posted a quarterly decline of -6%, but in Q4 2018 this decline had largely offset via a quarterly gain of +4%.
On the other hand, the Medical Professionals and Healthcare sector enjoyed a quarterly growth rate of +9% in Q3 2018 but then posted a quarterly decline of -1% in Q4 2018. While the overall annual trajectory has been a positive one, a certain amount of variability across the quarters has been evident in these sectors.
Job vacancies by location
Table 2: Percentage changes in job vacancies by location
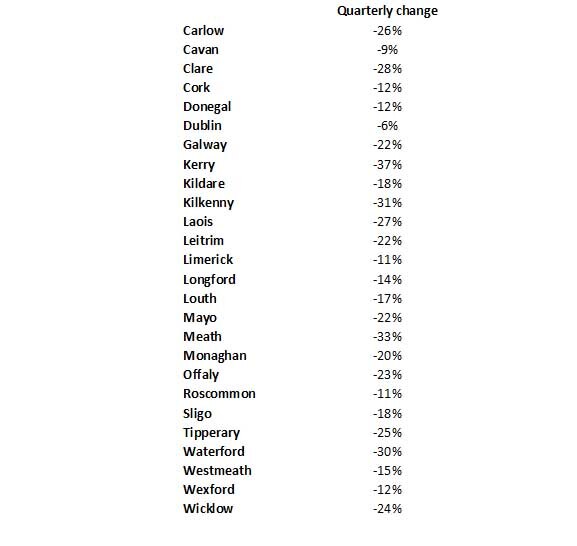
As regards vacancy gains by location, the quarterly fall in vacancies at the national level reflects a range of experiences at county level. All counties experienced a fall in vacancies in Q4. The largest quarter-on-quarter falls in vacancies have been recorded in Kerry (-37%).
Other counties experiencing large falls include Meath (-33%), Kilkenny (-31%) and Waterford (-30%). This contrasts with relatively small quarter-on-quarter falls in Dublin (-6%) and Cavan (-9%).
This IrishJobs.ie Jobs Index uses an indicator to provide an insight into the relative importance of the number of vacancies across locations. The indicator used, the job vacancy rate, is the official indicator used by Eurostat, the statistical office of the European Union. It measures the proportion of total positions that are vacant in a given location expressed as a proportion of total employment in that location combined with job vacancies (for details, see Methodology).
The results for Q4 2018 are mapped in Figure 5. As in the previous quarter, the highest job vacancy rates have been recorded in Dublin (95.9), Carlow (91.7) and Limerick (90.7).
This contrasts with the notably lower rates evident in traditionally economically peripheral counties such as Kerry (71.9), Donegal (72.7), Cavan (77.0) and Laois (77.7).
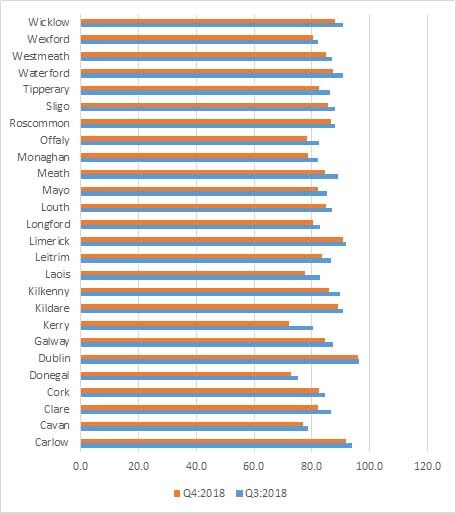
Figure 6 presents the changes in job vacancy rates since the third quarter. Compared to the third quarter in 2018, all counties have experienced a drop in their job vacancy rate, with the greatest percentage fall evident in Kerry (-10.4%). Other counties experiencing a relatively strong fall include Laois (-5.9%), Clare (-5.1%) Meath (-5.1%) and Offaly (-5.0%). Dublin (-0.3%), Limerick (-1.0) and Roscommon (-1.5) experience rather modest falls in the job vacancy rates.
The implications of low or high vacancy rates depend on the specific labour market context, notably the unemployment rate. Ignoring dynamics in the size of the labour force, the labour force participation rate, and inter-county commuting, we can distinguish four situations:
 Firstly, low vacancy rates may occur in areas with relatively high unemployment rates. This is clearly an undesirable situation, suggesting a general economic crisis or a structurally lagging region.
 Secondly, probably less common, high vacancies may coincide with low unemployment rates. This could be suggestive of a tight labour market that can be observed in localities experiencing economic expansion. Depending on one’s perspective, this could be interpreted as a negative or positive situation, although in the medium term the region runs the risk of wage inflation.
 Thirdly, low vacancies may coincide with low unemployment rates. Arguably this is the most benign situation.
 The final situation is characterised by a high vacancy rate and high unemployment. This could reflect a mismatch between the education/skills profile of the labour force and employers’ requirements. Such situations occur in areas undergoing industrial restructuring.
Dublin and Limerick, two counties residing among those with the highest vacancy rates, are characterised by differing situations. In light of the low and falling levels of unemployment in Co Dublin, we may surmise that this county is at risk of experiencing situation 2, involving a combination of high vacancy rates, low unemployment, and the concomitant emergence of wage inflation.
In contrast, the high and rising vacancy rate of Co Limerick occurs in a context of a relatively high unemployment rate. This is suggestive of a mismatch between the education/skills profile of the labour force and employers’ requirements in a region that is undergoing a process of industrial restructuring.
Figure 5: Vacancies per ‘000 in employment
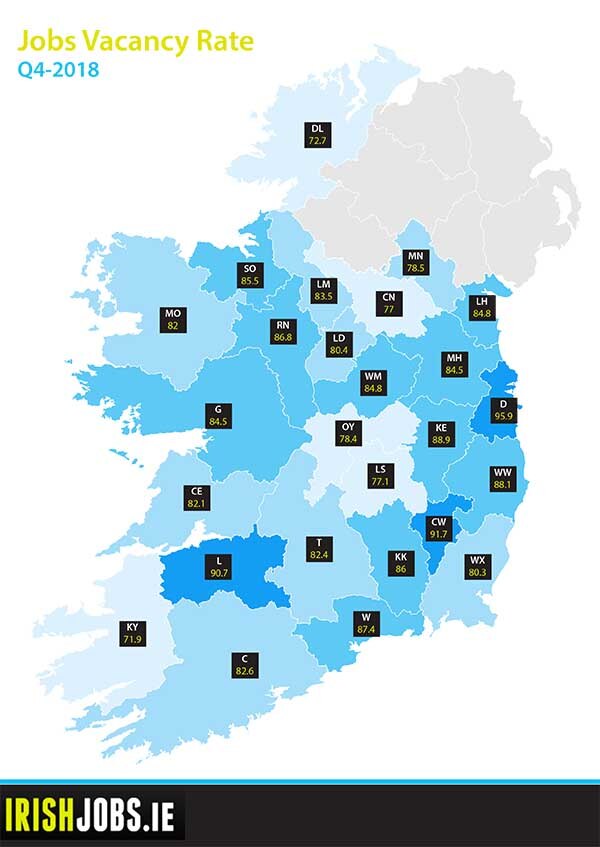
Figure 6: Vacancy rate by county — Q3 2018 and Q4 2018
Conclusion
The Q4 2018 Index reveals the extent to which job vacancy creation surged during 2018, increasing by +7% on an annual basis from Q4 2017. While 2018 has proved to be a year of robust job vacancy generation, ongoing global economic uncertainties–arising primarily from Brexit and the US economic outlook–lie ahead in the early quarters of 2019
Given these uncertainties, 2019 could be an eventful year for a number of Irish sectors. The following sectors, in particular, are likely to warrant further scrutiny over the coming year:
 (i) Banking and insurance: the recent announcement by IDA Ireland that over 55 Brexit-related investments have been approved by the end of 2018 would seem to auger well for job opportunities in banking and related sectors.
 (ii) Manufacturing: the practicalities of the eventual Brexit arrangement may involve disruptive supply chain re-organisation and, in the event of a hard Brexit, customs implications.
 (iii) Agri-foods: while Bord Bia has reported a +5% increase in dairy exports in 2018, overall food and beverage exports were down -4% for the year. Given that 37% of Irish food and beverage exports in 2018 were destined for the UK, the eventual Brexit outcome will be of particular significance for this sector.
 (iv) Tourism: while IrishJobs.ie data shows that the Irish hospitality sector continues to drive job creation, the recent return to a 13.5% tax rate for the sector may negatively impact upon staffing levels in the sector.
In terms of location, the quarterly fall in vacancies at the national level reflects a mix of dynamics at county level. The strongest quarter-on-quarter fall in vacancies has been recorded in Kerry (-37%). This contrasts with relatively modest falls in the border counties of Dublin (-6%) and Cavan (-9%). Dublin, Carlow and Limerick are recording the highest job vacancy rates, while Kerry records the lowest job vacancy rate.
This report, commissioned by IrishJobs.ie, is authored by economists Dr Declan Curran of Dublin City University and economic geographer, Dr Chris Van Egeraat.
Methodology
The report utilises a dataset comprising of all corporate jobs advertised on IrishJobs.ie and Jobs.ie from 1 October 2018–31 December 2018. Revisions to the data-gathering process mean that the figures stated in this report are not directly comparable to previous reports.
Job vacancy rate by location
To obtain an insight into the relative importance of the number of vacancies in specific locations, we use the official Eurostat indicator — the job vacancy rate.
The indicator, as defined by Eurostat, is calculated as the number of job vacancies divided by the numbers in employment plus the number of vacancies (job vacancy rate = number of job vacancies ÷ numbers in employment (in thousands) + number of job vacancies × 100).
Data pertaining to numbers in employment is available from the Quarterly National Household Survey. The QNHS provides employment figures at the level of the eight spatial planning regions in Ireland. The number employed per county has been estimated by applying the proportional distribution of employment across the counties in a given planning region, as reported in the latest CSO population census (2016).