IrishJobs.ie, as part of its quarterly Jobs Report, publishes county-level vacancy rates for the Republic of Ireland.
The vacancy rate provides an insight into the relative importance of the number of vacancies across Irish counties.
The vacancy rate is calculated as the number of vacancies in a given county divided by employment in that county (for details, see methodological note).
With financial support from IntertradeIreland, we have extended the geographical scope of this research to include Northern Ireland. In this Report, we present our all-island vacancy rate measure.
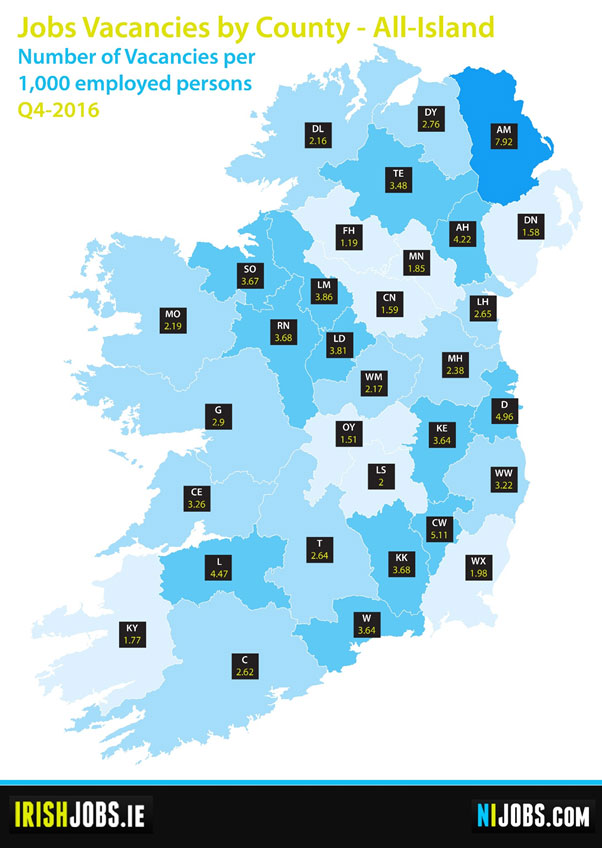
The results of our all-island calculations for Q4 2016 are mapped in Figure 1. On average, counties in Northern Ireland record higher vacancy rates than counties in the Republic of Ireland (average rates of 3.5 and 3.0 respectively).
However, we observe strong variation in vacancy rates across counties. Northern Ireland holds both the highest and lowest vacancy rate on the island. The highest rate is recorded in Antrim (7.9). This compares to substantially lower rates observed in Fermanagh (1.2) and Down (1.6). In the Republic of Ireland, the highest rates are recorded in Carlow (5.1) and Dublin (5.0).
In contrast, we find very low rates in some of the traditionally economically lagging counties — the border counties of Monaghan, Cavan and Donegal; the western peripheral counties Mayo and Kerry; and the Midlands counties Offaly and Laois.
At the same time, some traditionally lagging counties, such as Leitrim, Sligo and Roscommon, are performing relatively well. Taking a cross border perspective, we observe a cluster of low vacancy counties located in the central area of the cross-border region.

The high vacancy rate of Antrim may partly reflect travel-to-work patterns. Antrim contains a large number of the main employment centres (Belfast, Lisburn, Larne, Ballymena) as well as the main port and two main airports.
This has led to high levels of commuting, with people coming from right across the province to work in Antrim. These travel-to-work flows are not captured in the vacancy rate, as employment (the denominator of the vacancy rate) is calculated on the basis of where employed people reside. If included in the vacancy rate, these travel-to-work flows would lead to lower vacancy rates for the main employment centres.
However, the counties surrounding Antrim are not characterised by extremely low vacancy rates. Furthermore, Dublin, another county with a high-level of in-commuting, has a far lower vacancy rate that Antrim. This would suggest that the high vacancy rates are driven by more than travel-to-work patterns alone.
The implications of low or high vacancy rates depend on the specific labour market context, notably the unemployment rate. Ignoring dynamics in the size of the labour force, the labour force participation rate and inter-county commuting, we can distinguish four situations.
Firstly, low vacancy rates may occur in areas with relatively high unemployment rates. This is clearly an undesirable situation, suggesting a general economic crisis or a structurally lagging region.
Secondly, probably less common, high vacancies may coincide with low unemployment rates. This could be suggestive of a tight labour market that can be observed in localities experiencing economic expansion. Depending on one’s perspective, this could be interpreted as a negative or positive situation, although in the medium term the region runs the risk of wage inflation.
Thirdly, low vacancies may coincide with low unemployment rates. Arguably this is the most benign situation.
The final situation is characterised by a high vacancy rate and high unemployment. This could reflect a mismatch between the education/skills profile of the labour force and employers’ requirements. Such situations occur in areas undergoing industrial restructuring.
The lack of up-to-date county-level unemployment rate data prevents us from exploring the salience of these four situations. County-level unemployment data (Population Census) will not be available until the end of 2017. For the moment, in light of the low and falling levels of unemployment in both jurisdictions, we may surmise that counties Antrim and Dublin are at risk of experiencing situation 2, involving a combination of high vacancy rates, low unemployment, and the concomitant emergence of wage inflation.
Given the uncertainty in relation to the type of border that will emerge in a post-Brexit context, it is difficult to speculate on the effect that Brexit will have on the geography of vacancy rates. It is possible that Brexit implications regarding the movement of firms will have a greater impact on the vacancy rates of the main employment centres while changing levels of trade and commercial activity will disproportionately impact upon the already low vacancy rates observed in the border regions.
Methodology: Vacancy Rate by Location
The vacancy rate is calculated as the number of vacancies in a location divided by employment (in thousands) in that location. For the Republic of Ireland, the numbers employed are obtained from the Quarterly National Household Survey (pop 15+ in employment Q4 2016). The QNHS provides employment figures at the level of the eight spatial planning regions in Ireland.
The numbers employed per county are estimated by applying the proportional distribution of employment across the counties in a planning region as reported in the latest CSO population census (2011). For Northern Ireland, the employment data are drawn from the annual Labour Force Survey tables for Local Government Districts (LGDs). The latest data available from this particular source is for 2015. This LGD data is disaggregated to county-level using Census 2011 SA Employment data as a guide.