
The Irish economy is in robust good health. According to estimates by the CSO, in 2017, we were the fastest-growing economy in the EU for a fourth consecutive year. Unemployment is low at 6.1%, and is set to get even lower in 2019.
Ireland’s stellar report card is reflected in the latest edition of the IrishJobs.ie Jobs Index. Job vacancies increased by 9% in Q1 2018 compared to the same period last year, and by 17% on the previous quarter. Encouragingly, job creation is strong across multiple sectors: there were annual increases in high-tech sectors like pharmaceuticals and healthcare, and quarterly increases in accountancy and financial services.
In this edition of the report, we showcase the Job Vacancy Rate, a measurement of the vacancy-to-employment rate across Ireland. This measurement, when combined with further qualitative analysis, helps to shed light on the manner of job creation and the availability of labour.
Dublin, for example, has a high vacancy rate but a low unemployment rate, leading to wage inflation. Limerick, on the other hand, has a high vacancy rate and a comparatively high unemployment rate. This indicates that despite its fast-growing economy, the availability of professionals with particular in-demand skillsets is low.
Although the Irish economy is in a strong position, businesses must contend with continued political uncertainty. In the UK, Brexit continues. A transition agreement means the UK will remain a limited member of the bloc until 2020. A solution to the Border, however, remains elusive. To ensure uninterrupted revenue streams and job creation, Irish businesses must prepare for a scenario where trading with Great Britain–and the North–becomes restricted and more expensive.
The political situation is changing at home, too. The ‘confidence and supply arrangement’ between the minority Fine Gael government and traditional rivals Fianna Fáil is set to conclude before the end of the year. If this is the case, we could be going to the polls as early as Christmas. While a general election is unlikely to precipitate any shock results–and therefore a radical change in economic policy–hung parliaments and minority governments often lead to the stalling of important projects and policies.
Despite these challenges, the long-term outlook for Irish businesses is overall a positive one. This is good news for continued job creation in Ireland, and for professionals seeking to advance their career.
Orla Moran
General Manager, IrishJobs.ie
Key stats — INFOGRAPHIC
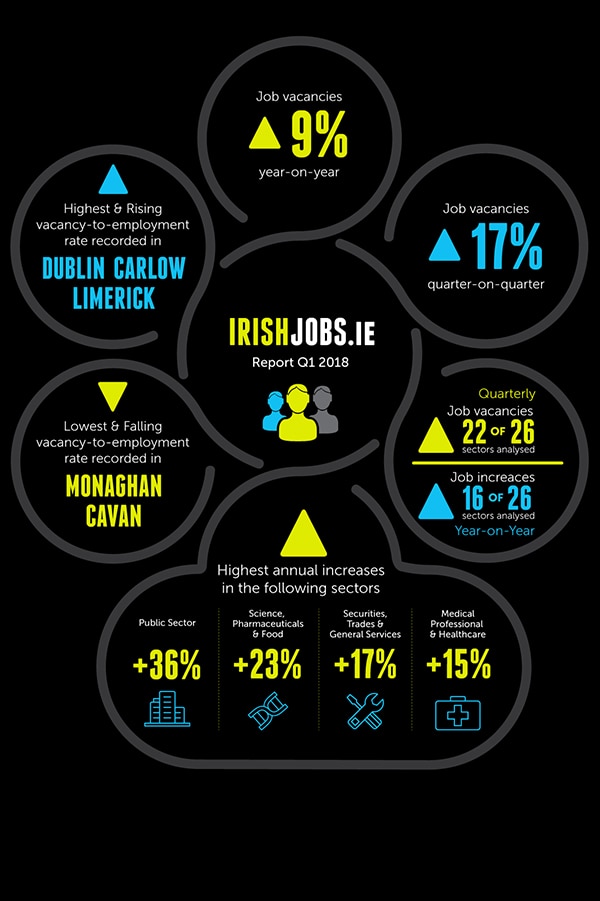
- Job vacancies up 9% year-on-year.
- Job vacancies up 17% quarter-on-quarter.
- Quarterly increases in job vacancies in 22 of the 26 of sectors analysed; year-on-year increases in 16 of the 26 sectors.
- Annual increases in public sector jobs; science, pharmaceuticals, and food; securities, trades, and general services; and medical professionals and healthcare.
- Strong first quarter increase in vacancy evident education, childcare, and training; accountancy and finance; telecoms; and secretarial and admin.
- Highest gain in vacancies in third quarter recorded in Longford (+85%).
- Highest and rising vacancy-to-employment rate recorded in Dublin, Carlow, and Limerick.
- Lowest and falling vacancy-to-employment rate recorded in Monaghan and Cavan.
Irish Jobs — the national outlook
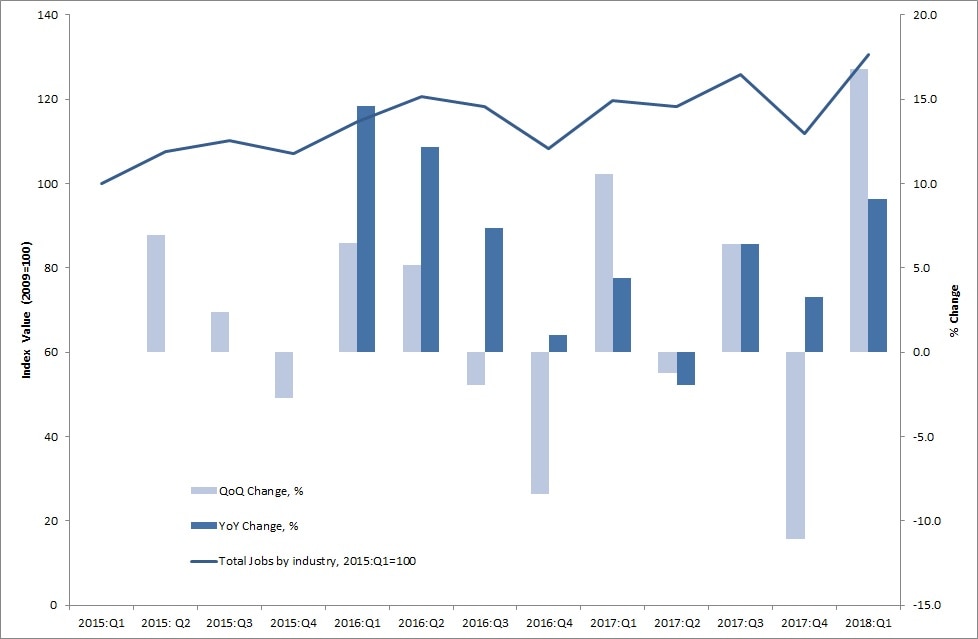
IrishJobs.ie data for Q1 2018 reveal a 9% year-on-year increase in total job vacancies, with quarterly job vacancies up 17% from Q4 2017. The 9% year-on-year increase maintains the upward average trend experienced throughout 2016. The sizable quarterly rebound from year end 2016 into Q1 2017 is in keeping with regular cyclical behaviour of quarterly jobs vacancies data, with first quarter rebounds of 6.5% and 10% having been recorded in Q1 2015 and Q1 2016 respectively (Figure 1, below).
By way of context, we begin by providing a brief synopsis of prevailing Irish economic conditions. The latest ESRI Winter Quarterly Economic Commentary notes that the Irish economy experienced output growth of approximately 7.8% in 2017 and expects the economy to experience further expansion in 2018.
Strong domestic sources of growth, along with improving international conditions, should lead to an expected growth rate of 4.8% in 2018. Irish exports should register significantly more modest levels of growth. Cross-border exports of goods increased annually by 2.4% in 2017. Services exports rose by 12.6%. On an annualised basis, personal consumption increased by 1.9% in Q4 2017. Retail sales are up 7.2%in the year to December 2017.
Unemployment and wages
The Irish labour market continues to perform very strongly. The seasonally adjusted figures for employment in the Irish economy continue to increase, with 66,800 jobs being added in the year to the Q4 2017 (+3.1%). The largest year-on-year growth rates were recorded in the administrative and support service activities (+15.0%), construction (+9.5%), and accommodation and food service activities (+8.7%) sectors.
The number of people out of work continues to decline. On a seasonally adjusted basis, the Live Register recorded a monthly decrease of 3,500 (-1.4%) in December 2017, resulting in a seasonally adjusted total of 241,000 people out of work. Initial figures for 2018 show the positive trend continuing. In January 2018 the number of people out of work was reduced by a further 3,000 (-1.2%) relative to December 2017. The occupational group with the largest number of people on the Live Register is still the construction-related craft sector. However, this sector did register the largest decrease over the past year. The ESRI forecasts the unemployment rate to average 5.4% through 2018 and 4.5% through 2019.
The CSO Labour Force Survey now also estimates regional level unemployment rates. Over the last year, Ireland has witnessed a substantial change in the spatial pattern of unemployment rates. In the final quarter of 2016, the Border region had the second highest unemployment rate in the State (8.9%). This rate has consistently fallen, with the result that by Q4 2017 the Border region has the lowest unemployment rate in the State (4.9%). The highest unemployment rates have been recorded in the Midlands (7.7%) and South-East (7.3%) regions.
According to the ESRI, growth in employment appears to be contributing towards increased wage pressures in the Irish economy. On an annual basis, average hourly earnings increased by 1.9% in Q4 2017. The largest increase for the quarter was observed in the professional, scientific and technical activities sector (+8.42%). Other notable increases occurred in ICT (+4.6%) and education (+4.4%). In light of strong domestic demand and the continuously positive labour market performance, the ESRI expects wages to increase over the coming years.
Job vacancies by sector
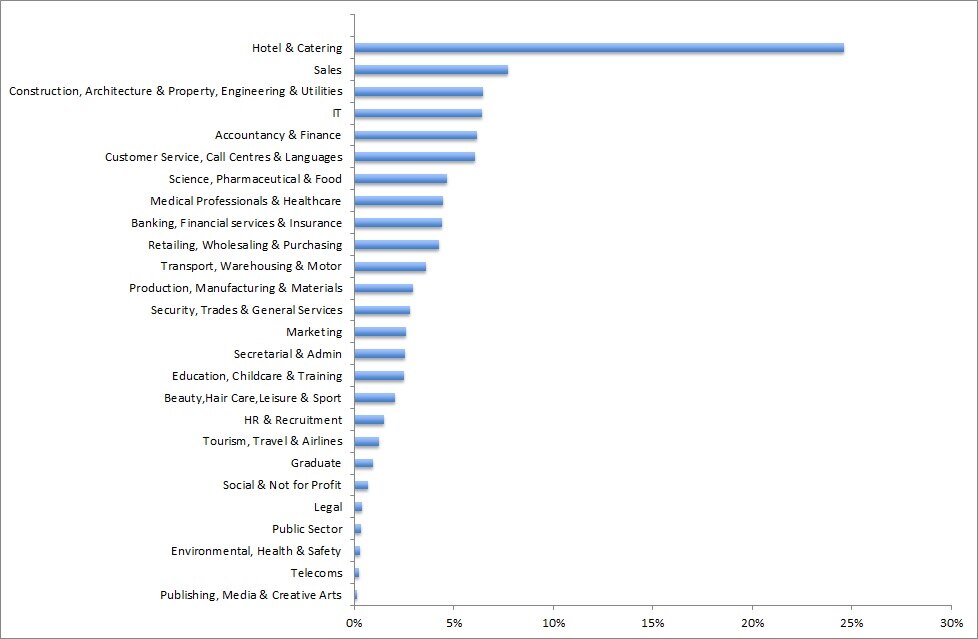
Figure 2 (below) provides a snapshot of the sectors that have generated the largest share of job vacancies in Q1 2018.
The largest five sectors, in terms of the proportion of vacancies generated in Q1 2018 are hotel and catering (25%); sales (8%); construction, architecture and property, engineering, and utilities (10%); IT (6%); and accountancy and finance (6%).
The performance of these sectors from Q1 2015 to Q1 2018 is illustrated in Figure 3. Of these sectors, it is the hotel and catering sector and the construction, architecture and property, engineering, and utilities sector that have posted the strongest performances over the period. Sectors such as IT and sales, while being large in scale, have seen their indices decline over time. Accounting and finance appears to have experienced a rebound in the most recent quarter, after contracting throughout 2017.
Further detail regarding the year-on-year and quarterly sectoral trends illustrated in Figures 2 and 3 is presented in Table 1 (below), with a number of distinct sectoral trends apparent. The largest annual increases have been experienced in public sector jobs (+36%); science, pharmaceuticals, and food (+23%); securities, trades, and general services (+17%); and medical professionals and healthcare (+15%). The largest annual declines in the index can be seen in graduate-specific roles (-32%); sales (-19%); banking, financial services, insurance (-15%); and legal (-15%).
Quarterly changes generally exhibit greater fluctuation than year-on-year figures. In keeping with the first quarter rebound discussed above, quarterly increases appear to be more widespread that year-on-year increases. Only four of the 26 sectors in our analysis post a quarterly decline, compared to ten sectors that experienced a year-on-year decline. The largest quarterly vacancy increases are evident in education, childcare, and training (+38%); accountancy and finance (+26%); telecoms (+29%); and secretarial and admin (+26%). The four sectors to decline on a quarterly basis were public sector (-19%); graduate-specific jobs (-7%); publishing, media, and creative arts (-6%); and legal (-2%).
Medical and science — a health check for Irish employment
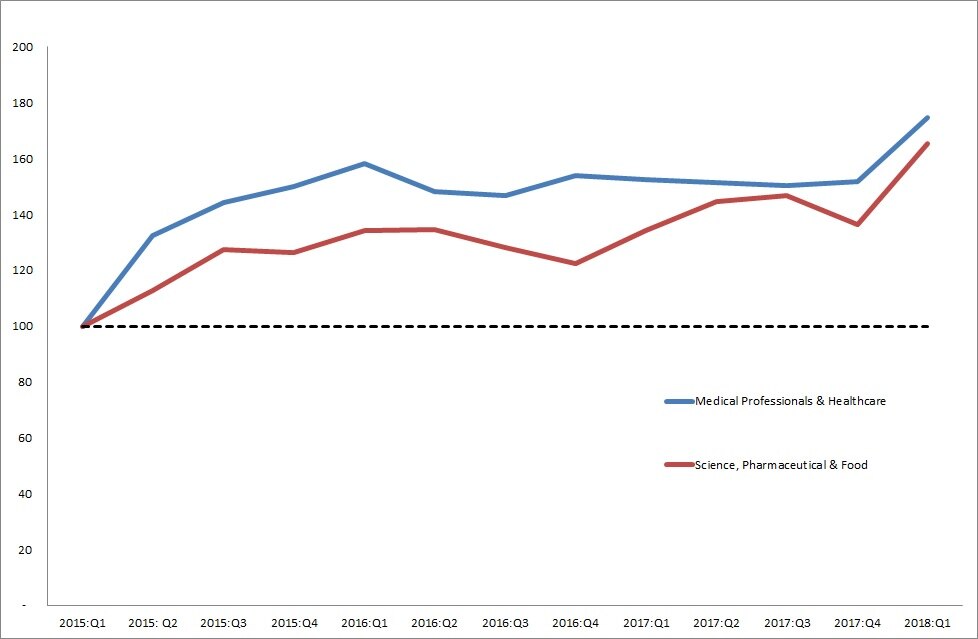
As per our previous IrishJobs.ie quarterly reports, we present the vacancy rates of two high-skill, high value-added sectors (medical professionals and healthcare; and science, pharmaceutical and food) as useful barometers of the Irish employment outlook.
From Q1 2017 to Q1 2018, job vacancies have increased strongly in both the science, pharmaceutical and food (+23% year-on-year) and medical professionals and healthcare sectors (+15% year-on-year). The science, pharmaceutical and food index exhibited a strong increase in the first three quarters of 2017, before falling back somewhat in Q4 2017 but subsequently returning to growth in Q1 2018. The medical professionals and healthcare sector appears to have plateaued somewhat across 2017 before experiencing an upturn in Q1 2018. As with the overall IrishJobs.ie Index, it remains to be seen whether or not the early momentum in Q1 2018 can be sustained into the coming quarters.
Job vacancies by location
As regards vacancy gains by location, the quarterly increase in vacancies at the national level reflects a uniform increase at county level. However, the range of increases is substantial. Twelve counties experienced a fall in vacancies over the second quarter.
The strongest quarter-on-quarter vacancy increase has been recorded in Longford (85%). Other counties that experienced substantial gains include the traditionally economically peripheral counties of Leitrim, Kerry and Sligo, each of which recorded gains of between 40% and 50%. This contrasts with relatively modest increases of less than 10% in Donegal (7%) and Laois (8%).
The year-on-year figures present a far more mixed picture. Eight counties recorded a fall in vacancies, with the strongest decreases recorded in Cavan (-26%), Monaghan (-15%) and Mayo (-12%). We also observe strong positive performances. The highest year-on-year increases have been observed in Donegal, Wicklow, Limerick, Galway and Carlow, all of which recorded increases of between 20% and 30%. The relatively modest quarter-on-quarter gains recorded may prove a short-term dip in an otherwise strong upward trend.
The Job Vacancy Rate
This IrishJobs.ie Jobs Index, for the first time, is using a new indicator to provide an insight into the relative importance of the number of vacancies across locations. The indicator used — the Job Vacancy Rate — is the official indicator used by Eurostat, the statistical office of the European Union. It measures the proportion of total positions that are vacant in a given location expressed as a proportion of total employment in that location combined with job vacancies (for details, see methodological note).
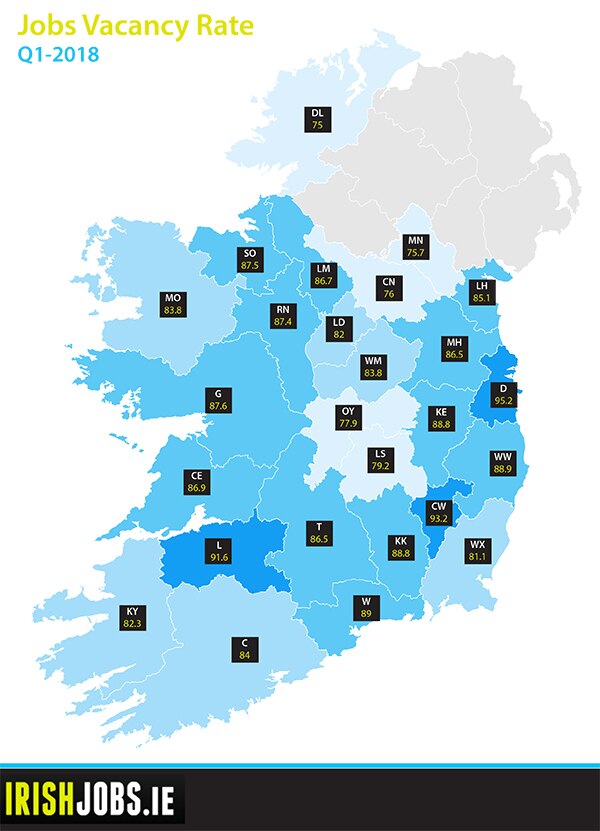
The results for Q1 2018 are mapped in Figure 5. The highest job vacancy rates have been recorded in Dublin (95.1), Carlow (93.2) and Limerick (91.6). This contrasts with the notably lower rates evident in traditionally economically peripheral counties such as Donegal (75.0), Monaghan (75.0), Cavan (76.0), Offaly (77.9) and Laois (77.9). Compared to the final quarter in 2017, Longford has made the strongest gain in vacancy rates (+15.3%). The smallest gains were recorded in Dublin (+0.6) and Waterford (+1.3).
Figure 6 presents the year-on-year changes in the vacancy rates. Eighteen counties have experienced an improvement in their job vacancy rate, with the greatest percentage increase evident in Donegal (+6.6%) and Galway (+3.4%). Cavan (-6.3%) and Monaghan (-3.8%) exhibit the greatest year-on-year fall vacancy rates.
The implications of low or high vacancy rates depend on the specific labour market context, notably the unemployment rate. Ignoring dynamics in the size of the labour force, the labour force participation rate, and inter-county commuting, we can distinguish four situations:
- Firstly, low vacancy rates may occur in areas with relatively high unemployment rates. This is clearly an undesirable situation, suggesting a general economic crisis or a structurally lagging region.
- Secondly, probably less common, high vacancies may coincide with low unemployment rates. This could be suggestive of a tight labour market that can be observed in localities experiencing economic expansion. Depending on one’s perspective, this could be interpreted as a negative or positive situation, although in the medium term the region runs the risk of wage inflation.
- Thirdly, low vacancies may coincide with low unemployment rates. Arguably this is the most benign situation.
- The final situation is characterised by a high vacancy rate and high unemployment. This could reflect a mismatch between the education/skills profile of the labour force and employers’ requirements. Such situations occur in areas undergoing industrial restructuring.
Dublin and Limerick, two counties residing among those with the highest vacancy rates, are characterised by differing situations. In light of the low and falling levels of unemployment in County Dublin we may surmise that this county is at risk of experiencing situation 2, involving a combination of high vacancy rates, low unemployment, and the concomitant emergence of wage inflation. In contrast, the high and rising vacancy rate of County Limerick occurs in a context of a relatively high unemployment rate. This is suggestive of a mismatch between the education/skills profile of the labour force and employers’ requirements in a region that is undergoing a process of industrial restructuring. Finally, Monaghan and Cavan’s low and falling vacancy rates, in combination with relatively high unemployment rates, are suggestive of a region in economic crisis (situation 1).
*Job Vacancy Rate = (number of job vacancies / thousands in in employment + Number of job vacancies) * 100.
In summary
The picture that emerges from the IrishJobs.ie Jobs Index, Q1 2018 is a positive one in terms of the upward economic trajectory across 2017. The report identifies a 9% year-on-year increase in total job vacancies.
Quarterly job vacancies, more prone to fluctuation than year-on-year figures, experienced a strong rebound in Q1 2018 (17%). While a first quarter rebound has been a regular feature of job vacancy data in recent years, the rebound appears to be widespread in sectoral terms. Of the 26 sectors analysed in this report, 22 sectors post positive quarterly job vacancy growth.
In terms of location, the quarterly increase in vacancies at the national level reflects a mix of dynamics at county level. The year-on-year figures range from growth rates of +27% for Donegal to -26% for Cavan. Dublin, Carlow and Limerick are recording the highest job vacancy rates, while Donegal and Monaghan record the lowest job vacancy rates.
Methodology
A note on the data
The report utilises a dataset comprising of all corporate jobs advertised on IrishJobs.ie and Jobs.ie from 1 January 2018 to 31 March 2018. Revisions to the data-gathering process mean that the figures stated in this report are not directly comparable to previous reports.
Job Vacancy Rate by location
To obtain an insight into the relative importance of the number of vacancies in specific locations, we use the official Eurostat indicator — the Job Vacancy Rate.
The indicator, as defined by Eurostat, is calculated as the number of job vacancies divided by the numbers in employment plus the number of vacancies (Job Vacancy Rate = number of job vacancies / numbers in employment (in thousands) + Number of job vacancies * 100).
Data pertaining to numbers in employment is available from the Quarterly National Household Survey. The QNHS provides employment figures at the level of the eight spatial planning regions in Ireland. The number employed per county has been estimated by applying the proportional distribution of employment across the counties in a given planning region, as reported in the latest CSO population census (2016).
This report, commissioned by IrishJobs.ie, was authored by economists Dr Declan Curran of Dublin City University and Dr Chris Van Egeraat