
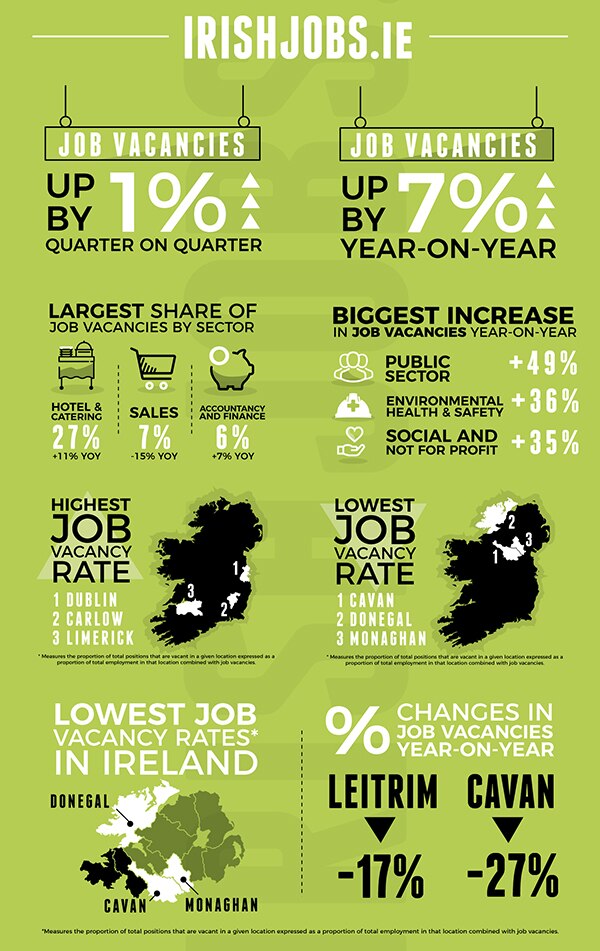
The IrishJobs.ie Jobs Index continues to record forward momentum in the Irish economy. Overall job vacancies have increased by 7% year-on-year and by 1% since the last quarter. Ireland’s business community, buoyed by a positive trading environment, is comfortable to invest in growth and create new jobs.
Job vacancy growth is evident in diverse sectors of the economy. Demonstrating the immense value of tourism and hospitality, hotel and catering jobs dominated Q2 2018 vacancies (27% of all vacancies, +11% YoY). While this sector typically spikes in the run-up to summer, the significant year-on-year increase is noteworthy and indicates sustained growth. The accountancy and finance industry, having declined in 2017, mounted a recovery in Q2, making up 6% of all job vacancies (+7% YoY).
Unsurprisingly, urban regions like Dublin, Cork and Limerick are the focal points of job creation, but other counties like Kerry and Meath have recorded increases of their own.
Rural growth is not a universal trend, however. IrishJobs.ie data suggests that the Border Counties region is in continued decline. Cavan and Leitrim recorded the lowest share of job vacancies in Ireland. Though this region has always been economically peripheral, failure to make it a more attractive place to do business could trigger a cascade effect whereby local businesses and professionals take flight to more lucrative parts of the country.
General risks present in Q1 2018 remain pertinent in Q2, the most pressing being Brexit. The same problems apparent in the immediate aftermath of the 2016 vote are still apparent in 2018. We do not know under what conditions businesses in the Republic of Ireland will be able to trade with or sell to businesses and consumers in Britain or even in Northern Ireland. So long as Brexit is an unknown quantity, job creation could stagnate in some parts of the economy.
However, Brexit is not entirely bad news for Ireland. The aforementioned recovery of Ireland’s accountancy and finance industry may suggest that UK-based companies, facing the increasing likelihood of a ‘hard Brexit’ or ‘no deal’ scenario, are advancing their contingency plans, which include establishing a presence or headquarters in Ireland, to a pre-implementation or implementation phase. This may well be mirrored in other highly skilled industries, like technology.
Ireland’s decade-long journey from deep recession to rapid growth is a testament to the benefits of an open economy and a business-friendly government. To maintain this upwards trajectory, and guard against major risks like Brexit, industry and government must work to address the chinks in Ireland’s armour, namely by ensuring we meet the skills requirements of a modern economy, and by providing the structural prerequisites for enterprise and job creation in regions outside the capital.
Orla Moran
General Manager, IrishJobs.ie
Irish jobs – the national outlook
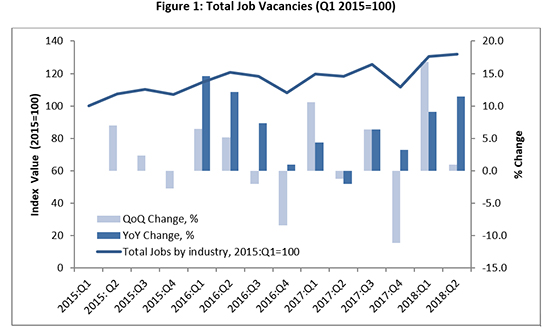
IrishJobs.ie data for Q2 2018 reveal a 7% year-on-year increase in total job vacancies, with quarterly job vacancies up 1% from Q1 2018. The 7% year-on-year increase is indicative of the sustained upward trajectory of vacancy generation throughout 2017 and into the first half of 2018. While the quarterly rate of 1% may appear to be modest, it builds on the strong quarterly performance posted in Q1 2017.
In order to set the scene for the current IrishJobs.ie Jobs Index, we provide a brief synopsis of prevailing Irish economic conditions. The latest ESRI Summer Quarterly Economic Commentary states that the Irish economy is on course to deliver another robust performance in 2018.
Strong domestic sources of growth, along with growth in global economic activity, should lead to an expected growth rate of 4.7% in 2018. According to the most recent data, in Q1 , Irish exports increased year-on-year by 4.3%. Consumption and investment are also expected to continue their upward trend. Retail sales are up 1.1% in the year to the first quarter of 2018.
Labour, skills and wages
The Irish labour market continues to perform very strongly in 2018. The seasonally adjusted figures for employment in the Irish economy continue to increase, with 62,100 jobs added in Q1 2018 (+2.9%).
The positive trend in employment is likely to continue, albeit at a slower pace. The largest year-on-year growth rates were recorded in the administrative and support service activities (+15.0%), construction (+9.5%), and accommodation and food service activities (+8.7%) sectors.
The ESRI identifies a skills mismatch in the Irish economy. This may be related to the change in the composition of economic activity. Employment in the construction sector remains 43% below its peak level in 2007, while employment in the information and communication sector is up 33.1%.
The number of people out of work continues to decline. On a seasonally adjusted basis, the Live Register recorded a monthly decrease of 3,100 (-1.3%) in April 2018, resulting in a seasonally adjusted total of 229,600 people out of work. The seasonally adjusted unemployment rate fell to 5.9% in April 2018. The ESRI believes that the unemployment rate will average 5.6% through 2018 and 5.0% through 2019. The occupational group with the largest number of people on the Live Register is still the (construction-related) craft sector. However, this sector did register the largest decrease over the past year (-17.9%).
The CSO Labour Force Survey estimates regional level unemployment rates. Over the last years Ireland has witnessed a substantial change in the spatial pattern of unemployment rates. The Border region traditionally had one of the highest unemployment rate in the State. This rate has consistently fallen, with the result that by Q1 2018 the Border region has by far the lowest unemployment rate in the State (4.4%). The highest unemployment rates have been recorded in the Midlands (8.0%) and South-East (7.2%) regions.
According to the ESRI, growth in employment appears to be contributing towards increased wage pressures in the Irish economy. On an annual basis, average hourly earnings increased by 2.5% in Q1 2018. The largest annual gain for the quarter occurred in the ICT sector, rising by 6.4%. Other notable increases occurred in financial, insurance and real estate activities (+4.1%) and education (+5.2%). In light of strong domestic demand and the continuously positive labour market performance, the ESRI expects wages to increase over the next two years.
Job vacancies by sector
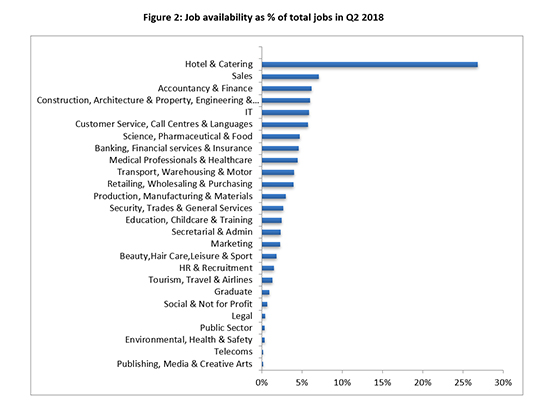
A snapshot of the sectors that have generated the largest share of job vacancies in Q2 2018 is provided in Figure 2 (below). The largest five sectors, in terms of the proportion of vacancies generated in Q2 2018 are hotel and catering (27%); sales (7%); accountancy and finance (6%); construction, architecture and property, engineering, and utilities (6%); and IT (6%).
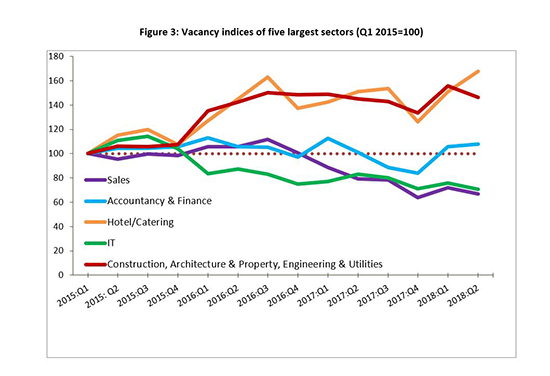
The performance of these sectors from Q1 2015 to Q2 2018 is illustrated in Figure 3. Of these sectors, hotel and catering and accountancy and finance have posted the strongest performances over the period. The strong performance of accountancy and finance is particularly notable, as the sector endured a marked decline in 2017 (with its Index value falling by 26% over the 12-month period). The sector has now grown for a second successive quarter in 2018, regaining most of the ground it had lost in 2017.
Two other sizeable sectors, construction, architecture and property, engineering, and utilities and sales, have fallen back somewhat in Q2 2018 after posting strong Q1 2018 performances.
 In order to further explore the distinct sectoral trends evident in Figures 2 and 3, Table 1 (below) sets out a detailed breakdown of Q2 2018 job vacancy trends across 26 sectors. At this sector-specific level, a number of distinct trends are discernible.
The largest annual increases have been experienced in public sector jobs (+49%); environmental, health and safety (+36%); social and not for profit (+35%); publishing, media and creative arts (+31%); legal (+29%); and transport, warehousing, and motors (+26%). The largest annual declines in the index can be seen in sales (-15%); IT (-15%); and graduate roles (-15%). In all, however, there is evidence of a broad base underpinning Q2 2018 vacancy growth: only six of the 26 sectoral categories exhibit an annual decline in vacancies created.
Given the strong rebound evident in Q1 2018 quarterly vacancy rates, it is not surprising that the figures for Q2 2018 are relatively muted. Strong quarterly growth is evident in environmental, health and safety (+36%); legal (+23%); publishing, media, and creative arts (+13%); and transport, warehousing, and motors (+13%). A number of sectors—such as accountancy and finance (mentioned above) and banking, financial services and insurance—post modest quarterly increases in vacancies (both +2%) but nonetheless are sustaining an upturn in their fortunes into the second quarter of 2018. A number of quarter declines are also evident in Table 1, such as telecoms (-24%); beauty, hair care, leisure and sport (-11%); and marketing (-11%).
Table 1.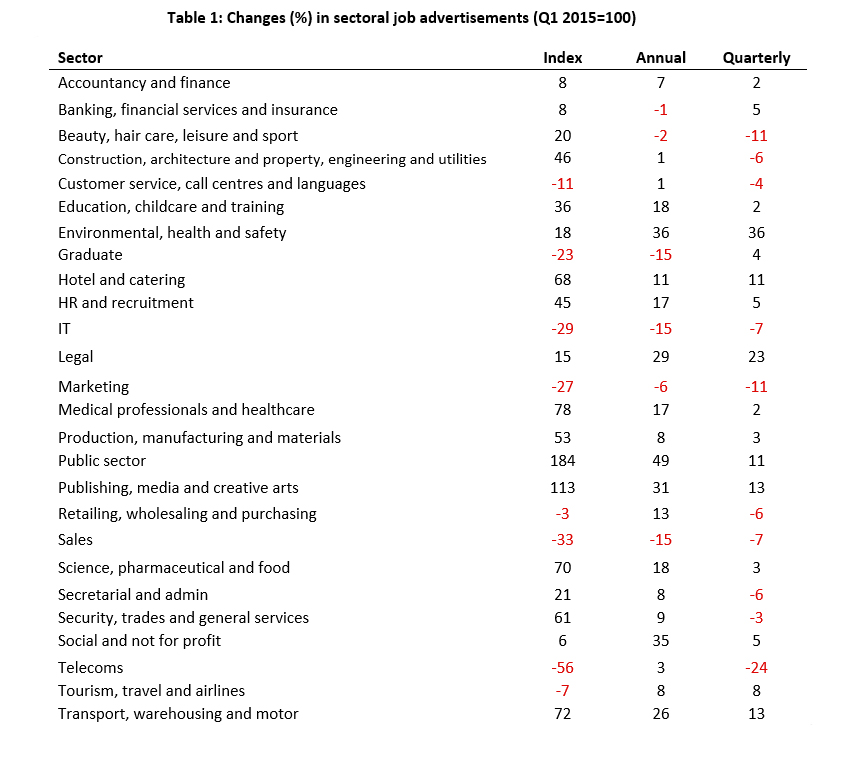
Job vacancies by location
As regards vacancy gains by location, the quarterly increase in vacancies at the national level reflects a range of experiences at county level.
Table 2.
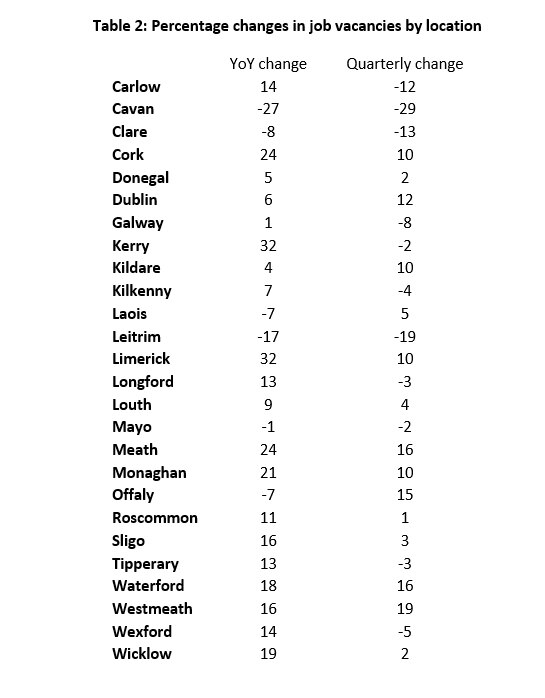 Fifteen counties experienced a rise in vacancies over the second quarter. The strongest quarter-on-quarter vacancy increase has been recorded in Westmeath (19%). Other counties that experienced substantial gains include Meath and Offaly, both of which recorded gains of 16%. This contrasts with relatively strong falls in the border counties of Cavan (-29%) and Leitrim (-19%).
The year-on-year figures present an even greater range of experiences. Six counties recorded a fall in vacancies, with the strongest decreases again recorded in Cavan (-27%) and Leitrim (-17%). But a substantial number of counties experienced strong positive performances. The highest year-on-year increases have been observed in Limerick and Kerry, with both counties recording increases of 32%. Other counties recoding strong gains include Meath (24%), Cork (24%) and Monaghan (21%).
Job vacancy rate
This IrishJobs.ie Jobs Index uses an indicator to provide an insight into the relative importance of the number of vacancies across locations. The indicator used, the ‘job vacancy rate’, is the official indicator used by Eurostat, the statistical office of the European Union. It measures the proportion of total positions that are vacant in a given location expressed as a proportion of total employment in that location combined with job vacancies (for details, see methodological note).
The results for Q2 2018 are mapped in Figure 5. The highest job vacancy rates have been recorded in Dublin (95.7), Carlow (92.4) and Limerick (92.3). This contrasts with the notably lower rates evident in traditionally economically peripheral counties such as Cavan (69.1) and Donegal (75.3) and Monaghan (77.3).
Compared to the first quarter in 2018, the rates are relatively stable. Offaly (+3.0%), Westmeath (+2.6%) and Monaghan (+2.2%) have made the strongest gains in vacancy rates. The largest decrease was recorded in Cavan (-9.1%).
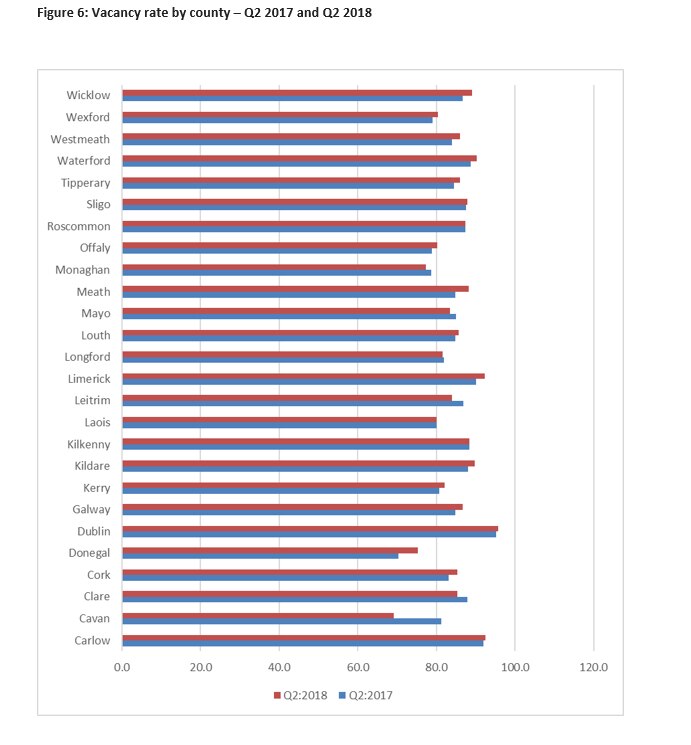
Figure 6 presents the year-on-year changes in the vacancy rates. Nineteen counties have experienced an improvement in their job vacancy rate, with the greatest percentage increase evident in Donegal (+7.1%) and Meath (+4.0%). Cavan (-14.9) and Leitrim (-14.9) exhibit the greatest year-on-year fall vacancy rates.
The implications of low or high vacancy rates depend on the specific labour market context, notably the unemployment rate. Ignoring dynamics in the size of the labour force, the labour force participation rate, and inter-county commuting, we can distinguish four situations:
- Vacancy rates may occur in areas with relatively high unemployment rates. This is clearly an undesirable situation, suggesting a general economic crisis or a structurally lagging region.
- Probably less common, high vacancies may coincide with low unemployment rates. This could be suggestive of a tight labour market that can be observed in localities experiencing economic expansion. Depending on one’s perspective, this could be interpreted as a negative or positive situation, although in the medium term the region runs the risk of wage inflation.
- Low vacancies may coincide with low unemployment rates. Arguably this is the most benign situation.
- The fourth situation is characterised by a high vacancy rate and high unemployment. This could reflect a mismatch between the education/skills profile of the labour force and employers’ requirements. Such situations occur in areas undergoing industrial restructuring.
Dublin and Limerick, two counties residing among those with the highest vacancy rates, are characterised by differing situations. In light of the low and falling levels of unemployment in Dublin we may surmise that this county is at risk of experiencing situation 2, involving a combination of high vacancy rates, low unemployment, and the concomitant emergence of wage inflation.
In contrast, the high and rising vacancy rate of Limerick occurs in a context of a relatively high unemployment rate. This is suggestive of a mismatch between the education/skills profile of the labour force and employers’ requirements in a region that is undergoing a process of industrial restructuring. Finally, Cavan’s low and falling vacancy rates, in combination with a relatively high unemployment rate is suggestive of a region in economic crisis (situation 1).
Figure 5: Vacancies per ‘000 in employment
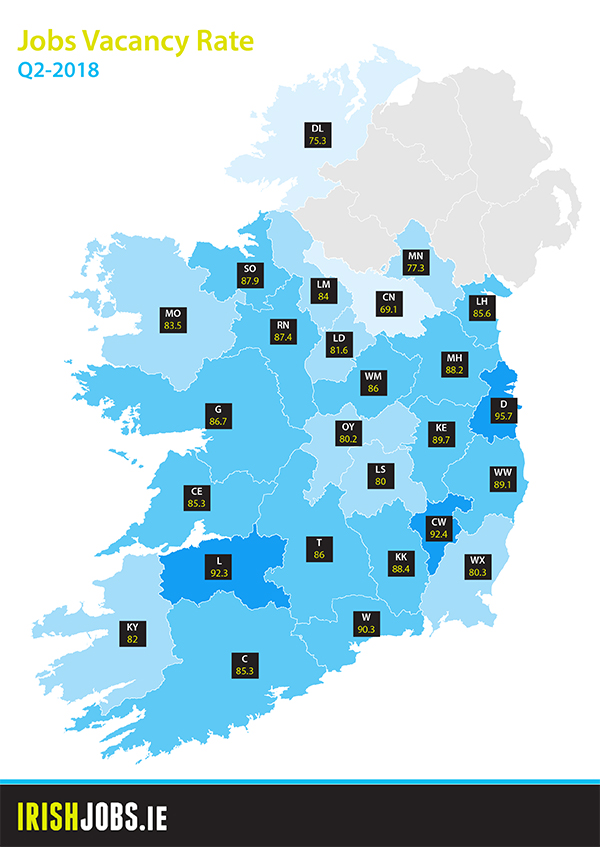
Figure 6: Vacancy rate by county – Q2 2017 and Q2 2018
 Conclusion
Recognising the need for timely indicators of workings of the Irish economy, the IrishJobs.ie Jobs Index provides insights into Irish job vacancy generation on both a quarterly and year-on-year basis. The pictures that emerges from the Q2 2018 IrishJobs.ie report is one of continued momentum across the first half of 2018.
Building on the upturn observed in early 2018, a broad-based increase in job vacancies across sectors has continued into Q2 2018. The IrishJobs.ie job vacancy index for Q2 2018 reveals a 12% year-on-year increase in total job vacancies, with quarterly job vacancies up 1% from Q1 2018. As illustrated by a number of sectors discussed in this report, such as accountancy and finance; banking, financial services and insurance; medical professionals and healthcare; and science, pharmaceutical and food, even relatively modest quarterly sectoral increases in job vacancies posted in Q2 2018 should be seen in the context of maintain this forward momentum across consecutive quarters.
The upturn in both the accountancy and finance sector and the banking, financial services and insurance sector is also of particular interest in the context of the ongoing Brexit saga. With the negotiation process still ongoing, any indication that overseas financial companies may be changing their outlook from “wait and see” to “pre-emptive move” warrants further scrutiny over the coming weeks and months.
In terms of location, the quarterly increase in vacancies at the national level reflects a mix of dynamics at county level. The strongest quarter-on-quarter vacancy increase has been recorded in Westmeath (19%). This contrasts with relatively strong falls in the border counties of Cavan (-29%) and Leitrim (-19%). The year-on-year figures range from growth rates of +32% for Limerick and Kerry, to -27% for Cavan. Dublin, Carlow and Limerick are recording the highest job vacancy rates, while Cavan records the lowest job vacancy rate.
A note on the data
The report utilises a dataset comprising of all corporate jobs advertised on IrishJobs.ie and Jobs.ie from 1 April 2018 to 30 June 2018. Revisions to the data-gathering process mean that this figures stated in this report are not directly comparable to previous reports.
Job vacancy rate by location
To obtain an insight into the relative importance of the number of vacancies in specific locations, we use the official Eurostat indicator, the ‘job vacancy rate’.
The indicator, as defined by Eurostat, is calculated as the number of job vacancies divided by the numbers in employment plus the number of vacancies (job vacancy rate = the number of job vacancies/numbers in employment (in thousands) + number of job vacancies * 100).
Data pertaining to numbers in employment is available from the Quarterly National Household Survey. The QNHS provides employment figures at the level of the eight spatial planning regions in Ireland. The number employed per county has been estimated by applying the proportional distribution of employment across the counties in a given planning region, as reported in the latest CSO population census (2016).
This report, commissioned by IrishJobs.ie, was authored by economists Dr Declan Curran of Dublin City University and economic geographer, Dr Chris Van Egeraat.
IrishJobs.ie has been helping people find the job they want for over 20 years. Our team is delighted to share our job hunting tips and advice with you.